
Mapping Panama Townships and Excel Data – The Key to Discover Spatial Stories
Data Analyses Made More Focused in Township-Level Mapping
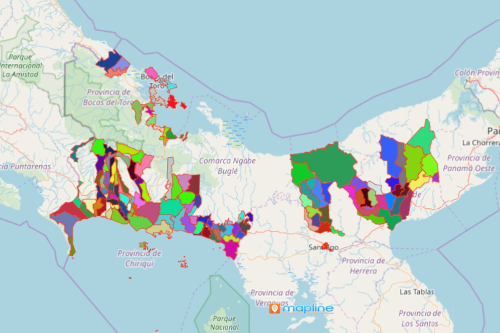
Mapping Panama townships may be a challenge for others but not for Mapline users. More popularly known as corregimientos, the townships are the smallest administrative division level in Panama. They are further divided into populated places or centres. Currently, there are 693 corregimientos in Panama. You can rarely find a cloud-based mapping platform like Mapline that offers unique territory boundaries such as Panama Townships. Therefore, make sure to create an Excel map with an overlay of township boundaries! As you plot the boundaries, you will discover that behind each location are heaps of additional variables. With heat mapping, get ready to visualize the highs and lows of the distribution across the boundaries.
A distance calculation tool comes in handy as you progress through spatial analysis in leaps and bounds. Understanding the spatial relationships between two places allows you to derive the right conclusion prompting for the best decision. Start measuring distances in just a few clicks!
Mapping Township Boundaries Like no Other
Start mapping now and discover the spatial relationships on your map. Start by following these simple steps:
- Create a Mapline account and login.
- Click the orange “Add New Items” button.
- Select “New Map” on the drop down arrow.
- Give your map a name and click “OK.”
- Click the “Add” button from the left sidebar.
- Select the “Territories” option.
- Click “From Mapline’s Repository.”
- From the “Territories” select “Panama Corregimientos (2019).” You can also enter that on the search bar.
- Select how you want your boundaries to be colored in “Fill Color” (Random Colors, Uniform Color, Dynamic heat map colors, or Custom colors from spreadsheet).
- Click “OK.”
Bring your data to life through mapping! Sign up now and take advantage of using only the best mapping tools for data analysis.