
Create a Puerto Rico Sub Barrio Map with an Impact
Sub Barrio-Level Mapping to Understand the Economic Situation Better
A Puerto Rico sub barrio map is useful for local authorities when monitoring their localities. Knowing the sub barrio boundaries is a sure way to mitigate and manage threats and risks. The municipalities in Puerto Rico are divided into minor civil divisions (MCDs) like barrios and sub barrios. They are used for reporting census data. It is best to understand the economic situation when location data is spread out on a map with an overlay of sub barrio boundaries. It creates a map with an impact! The data visualization shows how each sub barrio boundary copes up economically in this pandemic or in any other challenging situation.
To further your data analysis, a sub-barrio territory map motivates strong communication and collaboration within the community. Hence, the map can be embedded on a website so that the community is well informed about the ongoing crisis or challenges. Moreover, it can also be shared to team leaders, first responders, and essential workers to speed up service deliveries when needed, where needed.
Sub Barrio Map – Integral for Data Analysis
Create a sub barrio-based map to respond and operate in critical times more effectively:
- Create a Mapline account and login.
- Click the orange “Add New Items” button.
- Select “New Map” on the drop down arrow.
- Give your map a name and click “OK.”
- Click the “Add” button from the left sidebar.
- Select the “Territories” option.
- Click “From Mapline’s Repository.”
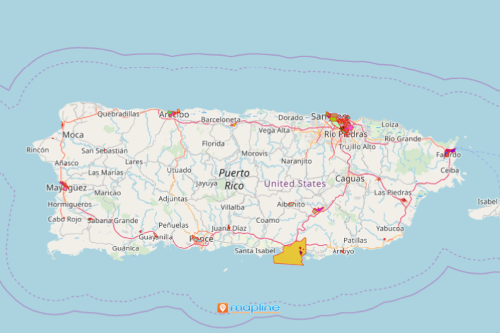
- From the “Territories” select “U.S. Subbarrio – Puerto Rico (2019).” You can also enter that on the search bar.
- Select how you want your boundaries to be colored in “Fill Color” (Random Colors, Uniform Color, Dynamic heat map colors, or Custom colors from spreadsheet).
- Click “OK.”
Mapline’s advanced mapping options are able to help many organizations in their efforts to provide powerful data analysis and visualization. Sign up now to learn which tools to use to respond more effectively in times of crisis.