
How a Guyana Region Map is Used in Agriculture
Region-Level Mapping to Drive Growth and Productivity
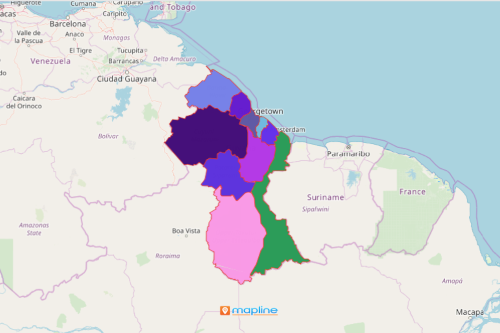
Guyana’s economy is one of the fastest growing in the world. Agriculture is one of it’s prime economy. Thus, agriculture and business sectors rely on a Guyana region map for a speedy data analysis. Guyana is divided into 10 regions. In Mapline, region boundaries are available to use to overlay on a map together with Excel spreadsheet of location data. The result? Absolutely powerful data visualization! A region-based map discovers patterns between locations. In addition, it connects the dots which helps organizations drive productivity and sustainability in agriculture.
As a mapping software, Mapline is committed to providing the best location intelligence tools. These tools are proven to help collect and analyze location data. Additionally, maps can be used to help optimize business operations. Furthermore, maps are also used to keep track and even cut costs on logistics.
Mapping Regions as a Tool to Drive Agriculture
Create a data-driven map with region boundaries to identify trends and relationships. Transform insights into actionable information! Mapline makes it easy to start mapping. Just follow these steps:
- Create a Mapline account and login.
- Click the orange “Add New Items” button.
- Select “New Map” on the drop down arrow.
- Give your map a name and click “OK.”
- Click the “Add” button from the left sidebar.
- Select the “Territories” option.
- Click “From Mapline’s Repository.”
- From the “Territories” select “Guyana Regions.” You can also enter that on the search bar.
- Select how you want your boundaries to be colored in “Fill Color” (Random Colors, Uniform Color, Dynamic heat map colors, or Custom colors from spreadsheet).
- Click “OK.”
Integrate location and boundaries to data analysis. Sign up now and learn more on how mapping can help optimize your strategies and plans to drive the best solution in the agriculture industry.