U.S. CORE BASED STATISTICAL AREAs (CBSAs)
- Territory Guide
- U.S. CORE BASED STATISTICAL AREAS (CBSAs)
Adding U.S. Core Based Statistical Areas (CBSAs) to your map can profoundly impact how you analyze regional patterns and optimize your business strategies. CBSA analysis is crucial for gaining deep insights into regional dynamics and optimizing operational strategies.
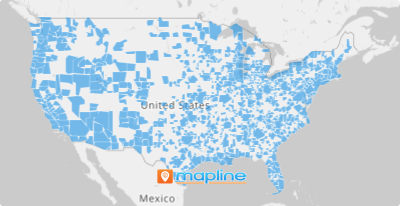
By visualizing these designated regions, which encompass both metropolitan and micropolitan statistical areas, you can pinpoint emerging market trends, streamline logistical operations, and tailor marketing efforts to specific urban and suburban demographics. This capability empowers businesses across various sectors, including Sales, Marketing, Dispatch, Logistics, Service & Maintenance, and Operations, to make data-driven decisions that drive growth and efficiency. Dive into the transformative potential of CBSA mapping! Let’s create your map of U.S. Core Based Statistical Areas now.
WHAT ARE U.S. CORE BASED STATISTICAL AREAS (CBSAs)?
U.S. Core Based Statistical Areas (CBSAs) are geographic regions defined by the U.S. Office of Management and Budget (OMB) as a geographic area consisting of one or more counties with an urban center with a population of not less than 10,000. Each area has adjoining counties that are connected to the urban center by commuting. These areas encompass metropolitan and micropolitan statistical areas, providing a standardized framework for regional analysis.
An area can be considered as CBSA if it has one of these characteristics:
- Metropolitan Statistical Areas with at least 50,000 population or more
- Micropolitan Statistical Area with at least 10,000 – 50,000 in population
- Combined Statistical Area combining adjacent Metropolitan or Micropolitan areas
Leverage a U.S. CBSA map to refine your sales territories, tailor marketing campaigns to urban demographics, or enhance your serivce and delivery efficiency. This type of map is a fantastic resource for tapping into new regional insights that drive strategic decision-making.
ADD U.S. CBSAs
Seamlessly incorporate U.S. CBSAs into your maps and watch your analytics level-up!
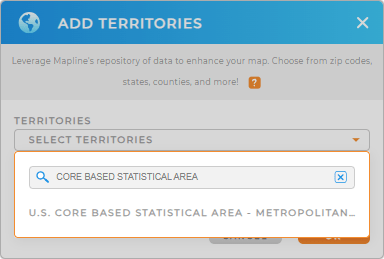
First, add a new territory from Mapline’s Repository, then type CORE BASED into the search bar. Select U.S. CORE BASED STATISTICAL AREAS, and you’re all set!
Use the search bar to type the keyword CORE and it will show you the right territory boundary.


Pro Tip: Mapline’s Repository offers an extensive list of territory boundaries globally, empowering you to explore and incorporate diverse geographical datasets beyond CBSAs. Expand your analytics with U.S. zip code boundaries, U.S. Urban Areas, or U.S. Counties. Then, add U.S. demographic data to your map to discover how different administrative boundaries impact your target audience!
CHOOSE CBSA COLORS
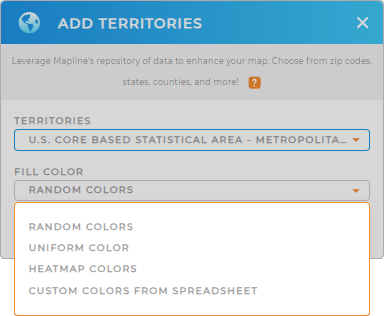
Color-coding U.S. Core Based Statistical Areas (CBSAs) facilitates data interpretation and operational optimization.
Select your preferred color styling to visually distinguish between different CBSAs, enabling quick insights into market performance metrics or demographic trends. When you’re done, click OK to apply your changes.

GET NEW TERRITORY INSIGHTS
Unlock a wealth of insights with Mapline’s powerful capabilities tailored for CBSA maps:
- Dive into detailed demographic data within CBSAs to understand population trends and consumer behavior
- Analyze market penetration across CBSAs to optimize sales strategies and identify growth opportunities
- Map your distribution centers and logistical hubs within CBSAs to streamline supply chain operations and enhance efficiency


