U.S. COMBINED STATISTICAL AREAS
- Territory Guide
- U.S. COMBINED STATISTICAL AREAS
U.S. Combined Statistical Areas (CSAs) are a powerful tool for demographic analysis. By understanding specific customer needs and trends within these areas, you’ll be better positioned to target the right socioeconomic groups, understand commuter patterns impacting your business, and capitalize on previously-overlooked opportunities. This level of mapping doesn’t just reveal where things stand—it shows you where to go next. Analyze each region with pinpoint clarity, spot hidden opportunities, and tackle obstacles head-on.
Plunge into the evolving landscape of CSAs now and transform your business strategy in just a few minutes!
WHAT ARE U.S. COMBINED STATISTICAL AREAS (CSAs)?
U.S. Combined Statistical Areas (CSAs) denote the 166 geographic entities defined by the Office of Management and Budget that consist of two or more adjacent metropolitan or micropolitan areas with significant social or economic ties. These areas are created by analyzing commuter patterns, making them powerful tools for demographic analysis.
By leveraging CSA-level insights, you’ll better understand overlaps between socioeconomic brackets, helping you develop hyper-targeted campaigns that address the specific needs and trends of your customers. This type of mapping significantly enhances business strategies and empowers you to skyrocket ROI. Check it out!
ADD CSAs TO MAP
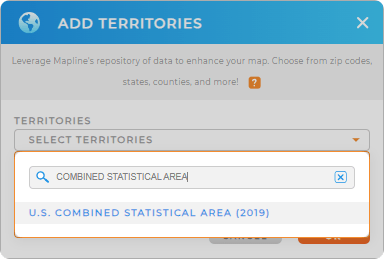
To create a map of U.S. Combined Statistical Areas, first add a new territory from Mapline’s repository, then type COMBINED into the searchbar and select U.S. COMBINED STATISTICAL AREA.
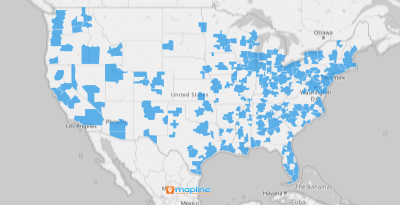
Woah, that was fast! You just seamlessly integrated CSA boundaries onto your map, providing a solid foundation for more informed decision-making. There’s just one more quick step, and then you’re done.


Pro Tip: The Office of Management and Budget coined the term Combined Statistical Area to refer to a combination of adjacent micropolitan and metropolitan areas that demonstrate socioeconomic connections measured by commuting patterns.
CHOOSE CSA MAP COLORS
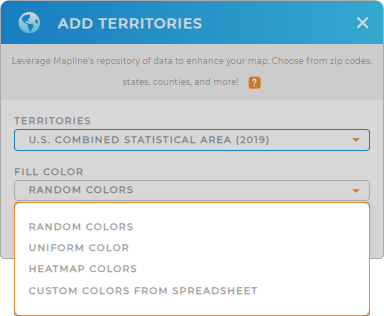
Customize the colors of your CSA map to unveil new insights at a glance! This is a powerful way to enhance your map and facilitate quick analytics.
This puts you in full control of your custom color styles. Just select your preferred type of fill color, click OK, and you’re all set!
Whether you’re analyzing market areas or seeking potential sales opportunities, leveraging color styles gives you the edge you need to extract rich insights and make data-driven decisions.

GET NEW TERRITORY INSIGHTS
Now you’re ready to analyze your CSA map like the pro you are. Leverage your map of U.S. Combined Statistical Areas to:
- Enhance your map with demographic data in seconds
- Compare your audience and locations to your CSA map with segments
- Quickly run distance calcuations and visualize gaps in service


