CREATE INSTANT CUSTOMER + SALES MAPS
- How To Guide
- CREATE INSTANT CUSTOMER + SALES MAPS
What if you could effortlessly see every customer’s location and status at a glance, no manual tracking necessary?
Great news: You have the power to create an instant customer map that keeps tabs on sales activities in real-time, 24/7!
Just import your data and boom! Instantly generate an interactive map that gives you real-time insight into your team’s hustle. And the best part? It auto-updates with every sales visit, keeping you informed and ahead of the ball.
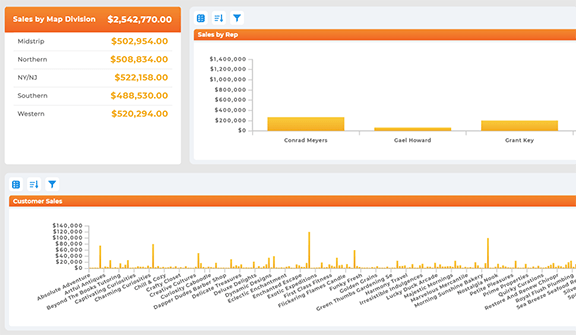
Need to impress the higher-ups? No sweat! Export detailed reports on all sales activities in a flash. Then, transform these reports into stunning visuals so your decision-makers get a clear picture of your operations for strategic planning.
Lead your sales team like the boss you are. Empower yourself to hold your team accountable, adapt to market changes, and stay ahead of competitor activities with strategies that keep you in the lead without breaking a sweat, leaving you free to focus on what really matters.
CREATE YOUR MAP
Here’s how to create a map of your customers and sales activities at lightning speed.
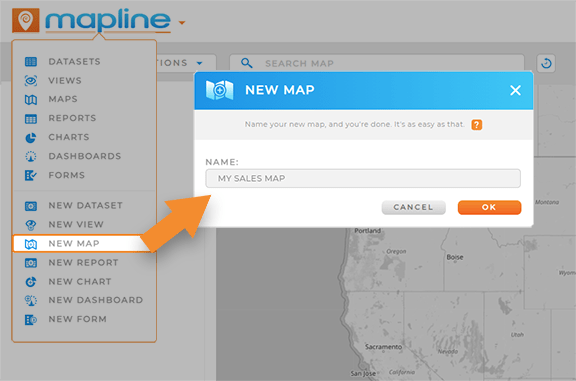
First, create a new map and add pins from an existing dataset in Mapline.
Alternatively, you can add pins from a spreadsheet. Click the ADD menu at the top left-hand corner of your map, hover over PINS, and select FROM SPREADSHEET. Copy and paste your spreadsheet data, and you’re good to go!
Now that you’ve laid the foundation, it’s time to unleash the full power of your customer map.

Pro Tip: Map bulk locations in seconds and easily visualize new leads, market competitors, or upcoming events! This helps you craft a comprehensive picture of all the moving parts you need to monitor.
CUSTOMIZE YOUR MAP
Now, let’s ensure that your map always displays the data you need to see. One of the best ways to achieve this is with dynamic pin styling, or in other words, color-coding locations based on your data.
This type of styling makes it possible to assess sales activities at a glance, empowering you to focus your attention where it’s needed most. First, you’ll need to configure your data. Let’s quickly review what your dataset needs to track sales performance in real-time.
CONFIGURE YOUR DATASET
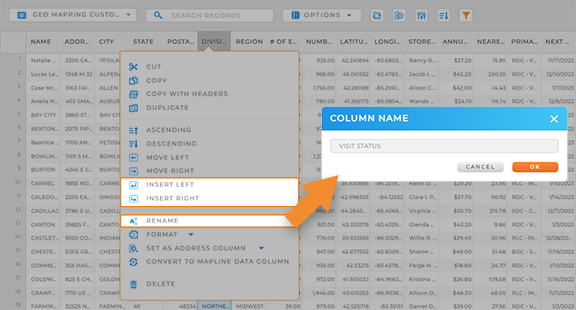
Right-click your map pin layer and select VIEW DATA. This opens the dataset from which your pin data is derived.
Next, let’s add a new column. Right-click any column and select INSERT LEFT or INSERT RIGHT. (You can easily adjust column placement later).
Name your new column VISIT STATUS, and you’re all set.
If you don’t have current sales data, don’t worry– we’re about to learn how to automatically collect data and eliminate the need for manual input.

Pro Tip: When you click VIEW DATA, you’re opening the underlying dataset itself. Any modifications you make will be reflected in the original dataset and also any visualizations (maps, charts, etc.) that depend on that dataset.
EMPOWER REAL-TIME REPORTING
Next, let’s empower your team to submit real-time sales data when they’re out in the field!
First, we’ll create a form that collects vital data from your reps.
Click the Mapline logo at the top-left of your screen and select NEW FORM. From here, customize your form to gather specific data relevant to each sales visit and rep. For instance, you may want to capture:
- Visit date
- Visit status
- Rep name
- Client name
- Client address
- Precise time stamp of visit
- Precise location at time of form submission
(If you already use a Mapline form to capture this data, skip ahead to the next step).
You can automatically import some of this data from your existing datasets so the form auto-loads when reps arrive on-site (how awesome is that!?). And rather than asking reps to fill out dozens of questions each time they submit a form, you can instead capture meta information, empowering your team to submit data and get right back on the road to capture the next sale.
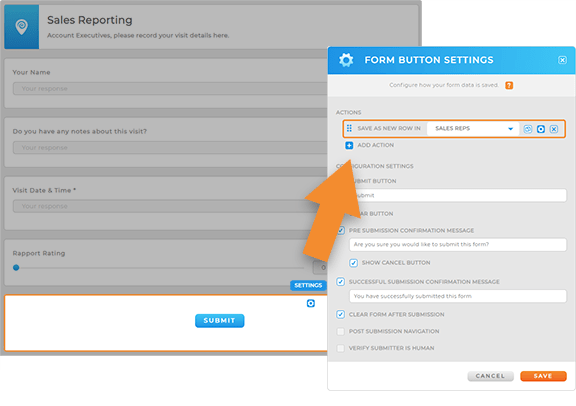
Finally, customize your form submit settings and ensure that your form data auto-saves to your customer dataset (this is the same dataset you used to create this map).
SEGMENT YOUR LOCATIONS
Now your dataset is ready! It’s time to segment your map pins so you can hone in on successful areas or underperforming locations!
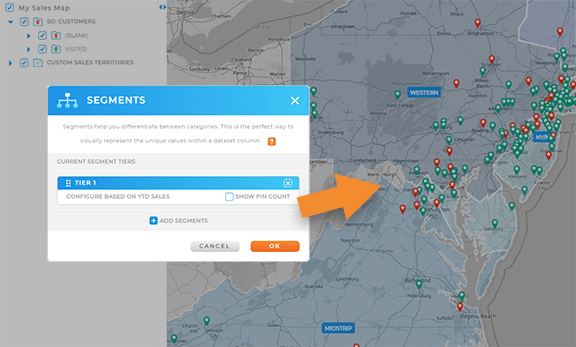
Navigate to the sidebar on the left-hand side of your map. Right-click the pin layer folder you’d like to customize, and then select SEGMENT. Configure your segmentation settings, then click OK to apply your changes.
And that’s it! Your map pins are now segmented based on your current data. From now on, whenever your data changes, the pins auto-update, giving you a precise snapshot of your sales activities every time you open your map.
WATCH YOUR MAP UPDATE IN REAL-TIME
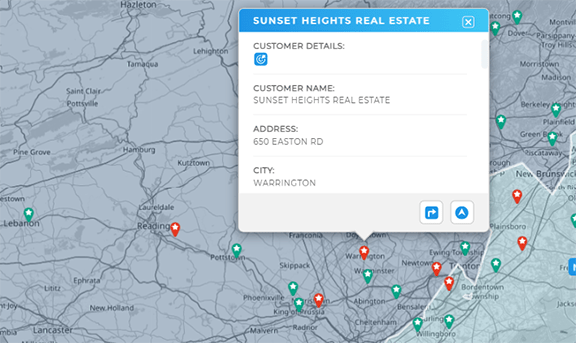
Wow! Now you can sit back and watch as your map updates with every sales visit! Never again wonder whether a rep finished their visits, or whether new leads are being nurtured.
Instead, just open your map and glance at your pins– and if you need information about a specific location, click the pin bubble to quickly view key details about each location. This makes it easy to quickly view follow-up status, customer notes, deal status, and any other information listed in your dataset.
ANALYZE & STRATEGIZE
Now, you have the power to easily monitor your team, track action items, hold your team accountable, and optimize every facet of your sales operations for the utmost efficiency. That’s some powerful stuff!
But what you have at your fingertips is much more than just a map–it’s a holistic system that empowers you to access a real-time snapshot of your operations and manage things like the pro you are.
Check out some of the incredible ways you can make your data work for you, gain new market insights, and really wow your stakeholders (and boss!):
PUT YOUR DATA TO WORK
You’ve laid a solid foundation for your sales tracking and analytics–now, this is the fun part!
Let’s say you want to identify market changes in seconds and craft strategies that keep you in the lead.
Well, that’s simple! Just empower your reps to capture new leads on the road, or submit detailed notes about market observations that impact sales. Then, you can automatically add new leads to your map and generate the visuals you need to identify the best strategies.
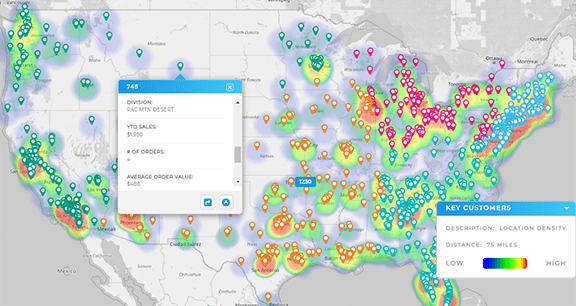
Once you’ve gained a deeper understanding of your audience, add demographics to your map to identify highly-saturated target markets and craft new strategies and campaigns to bring in more leads.
Finally, with custom dashboards and workflows, you can track the success of each new strategy or campaign and fine-tune your approach as needed.
Now, your sales team knows who to target, where to go, and which pitches resonate with which areas. And you’ll never have to wonder whether they followed up with a lead, because all of that information is a click away.
OPTIMIZE SALES OPERATIONS
And this is just the beginning! You’ve empowered yourself to monitor sales activities and craft new strategies, but you can do so much more with this system.
Get started with some of the most powerful capabilities available to sales teams in the modern world:
- Create automated workflows and fire off actions based on custom triggers
- Streamline and automate your expense reporting
- Automate lead intake and assignments so no oportunity falls through the cracks ever again
