Draw Rectangles to Customize your Maps
Analyze specific areas of your network in seconds
Location Analysis like never before
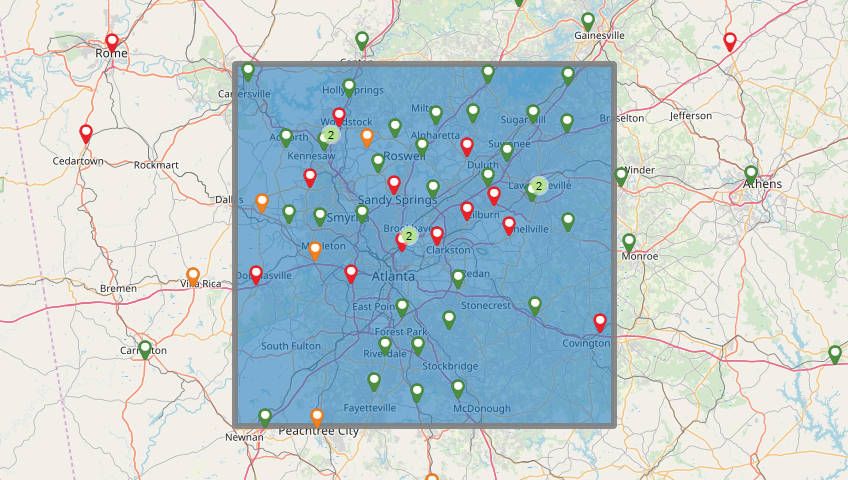
Using custom drawn rectangles, you can see exactly what is happening anywhere on the map. So if you need to revise your territories, or you just want to look at a specific grouping of locations, all it takes is a few seconds to see the data necessary for making decisions.


See what’s happening in your rectangles
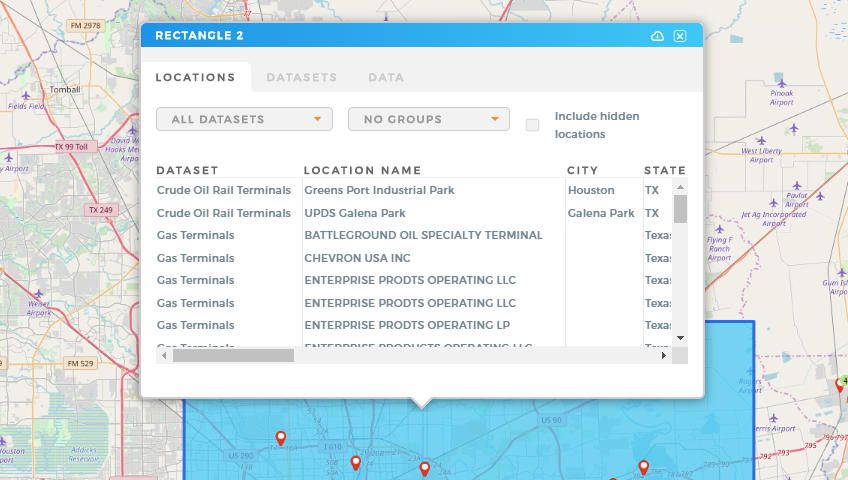
Once you’ve drawn rectangles on the map, you can click within any of them to gain detailed information about the locations inside them. Get the total square mileage and a summary of all locations that can then be exported for further use.
Customized Look for Easy Differentiation
After you’ve drawn your rectangles, you can easily customize how they appear on the map. Color them based on who is assigned to each section, or color them based on your data to appear like a heat map. You’ll be able to see which areas are your best performers in seconds.
Explore Our Mapping Features
Want to see what else you can do besides draw custom shapes on your territory maps? Check out our other features:


