Monitor Your Business Activity with Radial Heat Maps
Radial Maps Help Visualize and Present Your Data in Minutes
Whether you need visibility into sales territories, geographic regions, or anything in between—geographic heat maps make it easy to dive deep into business data. Heat maps and radial maps organize and color code your data so you can derive insights faster. Start visualizing and understanding your data today with Mapline.
Identify Areas with the Most Activity
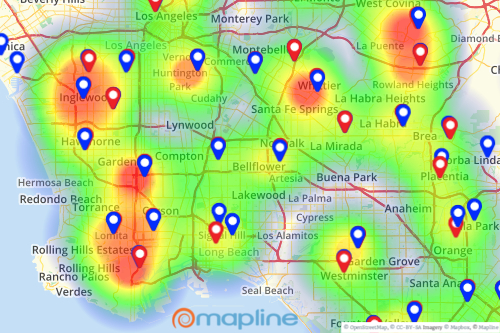
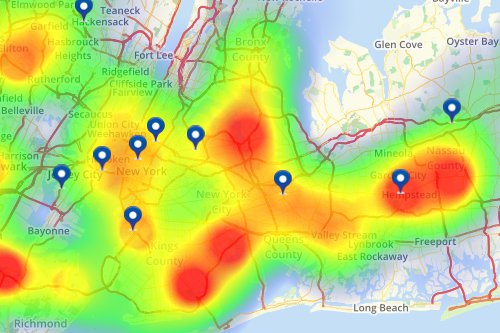
Heat maps use color-coded concentrations to show you what your densely populated areas are versus your least populated areas. This gives you clear visibility into your customer and sales activity. With Mapline, you can even identify pins that are clustered together in high-density areas using radius mapping


Analyze Your Data Faster
Radial heat maps are aligned radially to make it faster to analyze your data. The color-coded concentrations give you immediate insight into territory activity levels so you can more easily determine what areas to focus on. Make smarter, faster business decisions with data from radial maps.
Use Geographic Heat Maps to Grow Your Bottom Line
Once you know what territories and regions are drawing in the most customers and making the most revenue, you can easily make more strategic business decisions. Move your business forward with insights from geographic heat maps.
Uncover Patterns with Mapline’s Heat Mapping Tool
Explore Our Features
Want to see what else you can do besides heat mapping? Check out our other features:


