Plot Your Locations on a Map
Reveal New Business Opportunities with Map Plotting
Spreadsheets making your head spin? Organize your geographic data the simple way when you plot locations on a map. Mapline helps you place pins on a map, visualize sales and customer information, and gain the advantage in your industry.
Visualize all Your Data Points with Pins
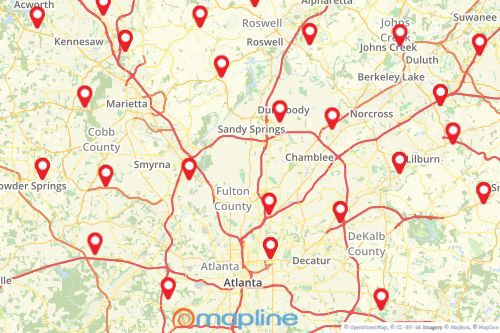
Don’t get lost in row after row of raw data. Having all your data points represented as pins on a map provides a detailed and organized visual of all your key business and customer information. You can plot points on a map in an instant. Just paste your Excel data into Mapline and you can see your locations on a map. It’s that easy to transform Excel data into an eye-popping pin map.

Make Data Analysis Faster and Easier
Plotting pins on a map does more than make your data visually appealing. By transforming your data into a visual map, analysis and planning become so much easier. The visualization also makes it easier for you to identify trends and insights that can significantly impact your business and bottom line.
Find New Opportunities
Business planning is that much easier with clear visualizations of your data. When you can see all your locations as pins, you can identify growth opportunities you wouldn’t have seen by looking at your Excel spreadsheet.


Customize Your Data and Locations
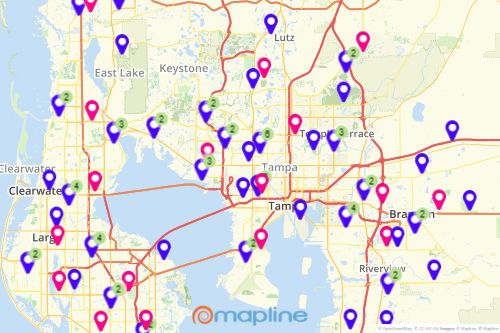
Mapline lets you even customize your data pins, so you can get a clear picture of which locations represent certain types of data.
Explore Our Other Online Mapping Features
Want to know what else you can do beyond creating a store locator map? Check out our other features:


