
Use a Rwanda Sector Map for Risk Management Planning
Why it is Important to Map Sector Boundaries
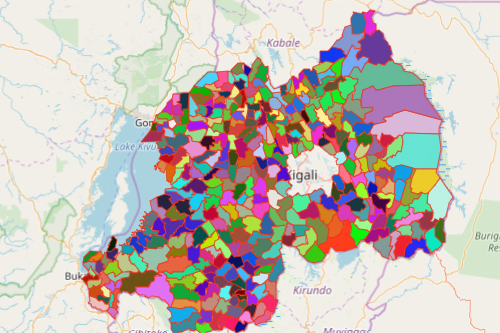
There are a lot of uses of a Rwanda sector map. For one, the sector map is often used in assessing and managing risks. Rwanda is a small country situated at the heart of Africa. Because of its high altitude, it gained its name as “land of thousand hills.” It is divided into 416 sectors. The Sector Executive Committee is responsible for public service and safety of each sector. Adding an Excel spreadsheet of locations to a sector map is a significant help in monitoring each sector boundary.
Another valuable mapping tool that helps assess risks is the radial heat map. When applied, it helps the users visualize and present the data in minutes! The radial design helps organize and color code data. This makes it easier to extract more data insights from territory activity levels.
Inform and Respond in Challenging Times by Sharing a Rwanda Sector Map
A sector map can be easily made. In just a minute or less, your map is ready to use. Then, share your map to other local government agencies. Sharing the information helps people in affected areas facing risks. It ensures that the steps taken are organized. All agencies are at one in following the necessary steps to mitigate the risks.
- Create a Mapline account and login.
- Click the orange “Add New Items” button.
- Select “New Map” on the drop down arrow.
- Give your map a name and click “OK.”
- Click the “Add” button from the left sidebar.
- Select the “Territories” option.
- Click “From Mapline’s Repository.”
- From the “Territories” select “Rwanda Sectors.” Use the search bar for quicker results.
- Select how you want your boundaries to be colored in “Fill Color” (Random Colors, Uniform Color, Dynamic heat map colors, or Custom colors from spreadsheet).
- Click “OK.”
Let us guide you through many other mapping tools for customized data analysis for risk mitigation and management. Sign up now and see how your Excel data makes more sense when mapped.