
Use Tunisia District Map for Better Location Understanding
District-Level Mapping for High-Performing Market Analysis
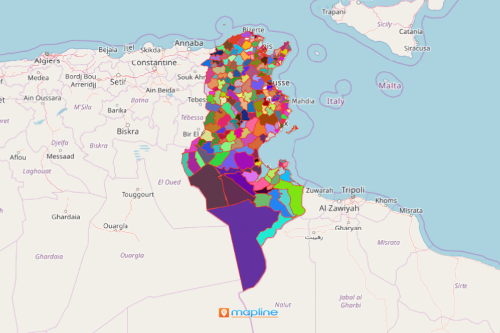
Companies from different industries use a Tunisia district map from decision making to business operation. They believe that when it comes to business, location is everything! Hence, using a map with district boundaries is crucial in every step of the business process – from planning to sales. Tunisia is a country located in Africa. It is divided into 246 districts or delegations. Thus, a map with an overlay of district boundaries creates an awesome data visualization that ignites ideas to help find new business opportunities and marketing strategies. District-level analysis helps to identify key correlations between district areas and sales trends.
Moreover, a data-driven territory map is used to further business analyses. Map Excel spreadsheet of location data. Filter the data to uncover patterns and trends that may be overlooked when data is just within the rows and columns of Excel spreadsheets. The insights are used for creating plans to come up with the organization’s competitive advantage.
District-Level Data Analysis
In just a few seconds, you can create a district map just by following these steps:
- Create a Mapline account and login.
- Click the orange “Add New Items” button.
- Select “New Map” on the drop down arrow.
- Give your map a name and click “OK.”
- Click the “Add” button from the left sidebar.
- Select the “Territories” option.
- Click “From Mapline’s Repository.”
- From the “Territories” select “Tunisia Districts.” Use the search bar for quicker results.
- Select how you want your boundaries to be colored in “Fill Color” (Random Colors, Uniform Color, Dynamic heat map colors, or Custom colors from spreadsheet).
- Click “OK.”
Sign up now so you can see for yourself how easy it is to filter your data based on the analysis that you like to obtain. Be wowed by your first-hand experience of many more smart mapping tools for better location understanding.