
How a Japan Region Map Exposes New Patterns in Data Analysis
Wring Out Information Through Region-Level Mapping
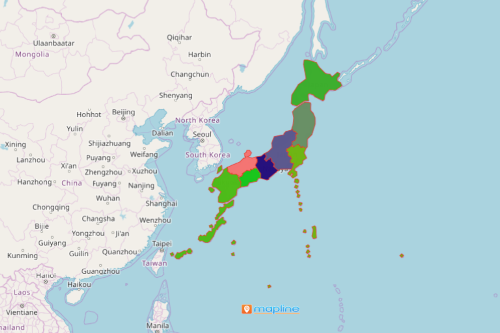
A growing number of organizations are creating a Japan region map to help them understand their Excel spreadsheet better. Mapline provides an exceptional mapping tool that allows the users to overlay territory boundaries to their maps. One boundary that is often used is the region boundary of Japan. The country has 8 regions. These regions are used mainly for statistical purposes. Hence, when data analysis is viewed with an overlay of boundary, the hidden meanings of rows and columns of Excel spreadsheet are understood. Ideas extracted from these analyses are vital to decision making.
A regional-level analysis is highly useful in understanding each region. For example, the users are able to understand the uniqueness of each region. They are able to realize which region has an edge when it comes to manufacturing. On the other hand, they are also able to pinpoint which regions have opportunities and need more assistance.
Map Boundaries to Get The Most Relevant Information
Needless to say, the Japan region helps to attain goals in decision-making and planning in the shortest amount of time. Indeed, adding boundaries to a map is an insurmountable help when it comes to understanding the relationship of location data and its borders. More than that, it also provides more insights. Here’s what you can do to start mapping:
- Create a Mapline account and login.
- Click the orange “Add New Items” button.
- Select “New Map” on the drop down arrow.
- Give your map a name and click “OK.”
- Click the “Add” button from the left sidebar.
- Select the “Territories” option.
- Click “From Mapline’s Repository.”
- From the “Territories” select “Japan Regions.” You can also enter that on the search bar.
- Select how you want your boundaries to be colored in “Fill Color” (Random Colors, Uniform Color, Dynamic heat map colors, or Custom colors from spreadsheet).
- Click “OK.”
A territory map is your go-to when deciding about risks and opportunities, looking for new markets, or understand customer buying habits. Sign up now to know more about territory mapping and how it helps expose new patterns in data analysis.