
Uncomplicate Geographical Analysis by Using Ukraine Region Map
Region-Level Mapping Produces Actionable Insights
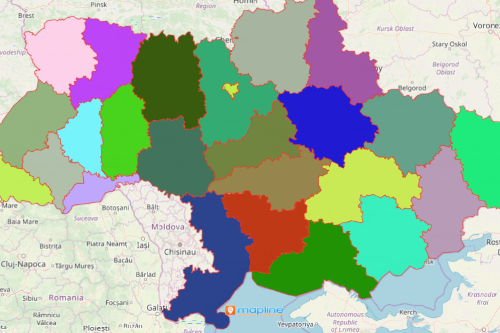
Data analysis is made easier and simpler with the use of Ukraine region map. Ukraine is the second largest country in Europe. The regons are made up of 24 provinces, 1 autonomous republic, and 2 cities of special status. Its top economic factor is exporting grains. A region map makes data visualization not only attractive to look at. More than that, the map helps get more sense of the data. How is that possible? Adding an Excel spreadsheet of location data brings in more valuable insights. It brings in the connections and relationships of location data to their respective boundaries thereby uncomplicating geographical analysis.
A data map with regional boundaries is very crucial in leveraging territory mapping for your business. Of course, companies would not want a generic business plan. Instead, they are looking for customized plans that tailor-fit their goals that can be accomplished in a minimum span of time. Hence, heat mapping is an effective way to achieve that. It helps you visualize areas that outperform the rest. Additionally, it can be shared in just a few clicks!
Be Empowered in Data Analytics by Mapping
Overcome hurdles in mapping. Follow these easiest steps to get you started with creating your map of Ukraine regions:
- Create a Mapline account and login.
- Click the orange “Add New Items” button.
- Select “New Map” on the drop down arrow.
- Give your map a name and click “OK.”
- Click the “Add” button from the left sidebar.
- Select the “Territories” option.
- Click “From Mapline’s Repository.”
- From the “Territories” select “Ukraine Regions.” You can also enter that on the search bar.
- Select how you want your boundaries to be colored in “Fill Color” (Random Colors, Uniform Color, Dynamic heat map colors, or Custom colors from spreadsheet).
- Click “OK.”
Sign up now and learn more on how to uncomplicate data and geographical analysis. Learn more about radial heat mapping to help you gain actionable insights from your data.