MEXICO STATES
- Territory Guide
- MEXICO STATES
A map of Mexico states is a powerful tool for regional analysis. By visualizing patterns and trends at this state level, brands can get granular insights into local market trends, consumer behavior, and other demographic factors unique to each state. This level of analysis is especially useful for businesses looking to fine-tune their strategies, tailor marketing efforts, or expand into new areas with a clear understanding of regional dynamics.
Uncover insights that you never knew existed when you make this state map an integral part of your analytical toolkit. After all, it only takes a few seconds. Ready? Let’s get started now!
WHAT ARE MEXICO STATES?
Mexico’s diverse cultural, economic, and geographic landscape makes it ideal for regional analysis. With 31 states and Mexico City as a federal entity, each region offers unique characteristics that can impact market dynamics and business opportunities. From the industrial hubs of Nuevo León and the tourism-driven economy of Quintana Roo to the rich cultural heritage of Oaxaca, Mexico’s states showcase distinct economic activities, consumer behaviors, and resource availability.
Mapping these states provides clear advantages for brands enabling targeted market entry, enhanced market understanding, and strategic allocation of resources.
ADD MEXICO STATES
There are a lot of geographical insights that you can get just by making your analysis on a state-wide level. With state boundaries added to your map, you can now discover untapped patterns in each state and identify market opportunities.
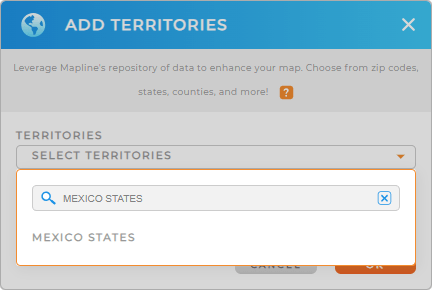
Mapping Mexico states is a breeze! Just add a new territory from Mapline’s repository. In the search bar, type in MEXICO and you’ll be directed to click on MEXICO STATES.
Isn’t that handy?


Pro Tip: Take your analytical game to new heights by seamlessly combining different territories to capture powerful location insights. Mapline’s Repository contains a list of hundreds of territories from countries around the world, including Mexico municipalities and states to quickly add to your map.
CHOOSE STATE COLORS
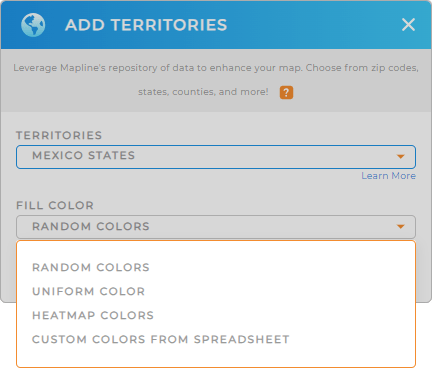
Now, let’s move on to the next step. That’s to fill your territory colors. for your territory. Color-coded territories help ignite ideas from location analysis. When presenting your map, you can choose random colors to distinguish each state. The heatmap colors or custom colors from your spreadsheet are great choices if you want to understand what your data is telling you.
Present the best color styles to aid in a deeper understanding of your data on each state boundary.
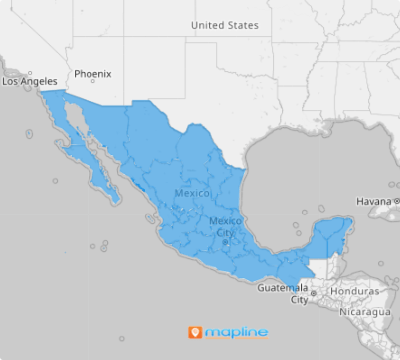
Lastly, click OK. And there you have it! Your Mexico State map is ready to use to target in-depth state-level analysis.

GET NEW TERRITORY INSIGHTS
What else can you do with your map of Mexico states? Try these capabilities as you analyze data and territories:
- Optimize your business operations with advanced routing
- Generate heat maps to visualize assets, operations data, and market intelligence
- Filter your data on your analysis to reveal new opportunities for growth


