U.S. CENSUS TRACTS
- Territory Guide
- U.S. CENSUS TRACTS
Unlock powerful insights with U.S. Census Tracts, and transform your business strategy with precise, neighborhood-level analysis. Census tracts facilitate detailed analysis of population demographics and housing characteristics, helping you make data-driven decisions. Mapping your figures across census tract boundaries transforms complexity into clarity. What once was a blur of spreadsheets becomes a dynamic, visual playbook—revealing performance gaps, regional strengths, and untapped opportunities.
Let’s add U.S. Census Tracts to your map now and elevate your business intelligence!
WHAT ARE U.S. CENSUS TRACTS?
U.S. Census Tracts are small, relatively permanent geographic areas defined by the U.S. Census Bureau to approximate neighborhoods. These areas, typically housing between 2,500 and 8,000 residents, offer detailed insights into population characteristics, economic status, and living conditions. By analyzing Census Tracts, you can access granular data that reveals trends in demographics and housing, providing a rich understanding of specific markets.
Census Tracts are a powerful way to analyze community-level data and tailor your business strategies effectively. fine-tune your sales strategies, refine your pricing strategies, and connect with local communities in a meaningful way.
ADD U.S. CENSUS TRACTS
Effortlessly add U.S. census tracts to your map so you can focus on analytics and strategy. Talk about a time saver!
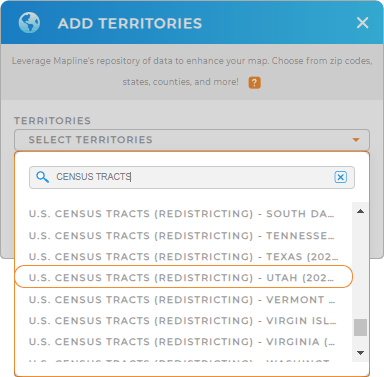
First, add a new territory from Mapline’s repository and type CENSUS TRACT on the search bar.
Census tract boundaries are available by state. Simply select your desired state from the drop-down menu and you’re finished with the first step!


Pro Tip: Mapline’s Repository provides the latest census tract boundaries from the U.S. government. To get the most current data, select the most recent year from the drop-down menu. (The latest census was in 2020, and the next one will be in 2030).
CHOOSE CENSUS TRACT COLORS
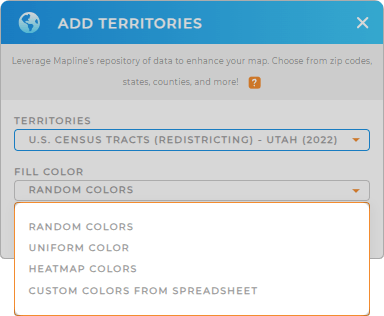
Customizing the colors of your Census Tracts map enhances your ability to visualize and analyze data. By applying different color styles, you can easily distinguish between different key metrics.
Simply select your desired type of color styling then click OK to bring your map to life.
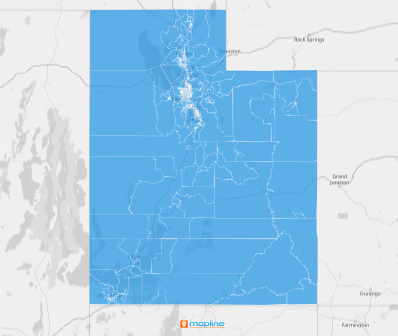
Now you’re ready to uncover the trends and opportunities hidden in your data!

GET NEW TERRITORY INSIGHTS
But it doesn’t stop there! Unlock deeper insights and refine your business strategies with these powerful capabilities:
- Understand community-level demographics and trends with Mapline data
- Delve into the precise inisghts you need by customizing reports
- Leverage coverage areas to analyze spatial patterns and pinpoint high-potential areas


