U.S. Congressional Districts
- Territory Guide
- U.S. Congressional Districts
Discover the power of keeping up with the latest changes in U.S. Congressional Districts. With Mapline, you can effortlessly create a map showcasing the redistricting that occurred after the latest census.
Dive into the evolving landscape of congressional districts, and explore the impact on your analytics and strategies. Let’s get started!
WHAT ARE U.S. CONGRESSIONAL DISTRICTS?
The US comprises 435 congressional districts, each representing approximately 700,000 people, with additional representation from the federal district of Washington, D.C., and the five inhabited US territories. These districts play a pivotal role in shaping legislation and governance.
Beyond politics, understanding congressional districts can offer businesses invaluable insights for strategic marketing initiatives. By leveraging Mapline to map out these districts using demographic data, businesses can pinpoint target markets, tailor marketing campaigns, and optimize outreach efforts, ultimately driving growth and maximizing impact.
ADD CONGRESSIONAL DISTRICTS
Let’s say you’re a regional sales manager tracking performance across your team. With the latest redistricting data on Mapline, you can instantly visualize the impact of congressional changes on sales territories. This clarity allows you to strategically allocate resources, identify growth opportunities, and ensure your team’s success in the ever-evolving political landscape.
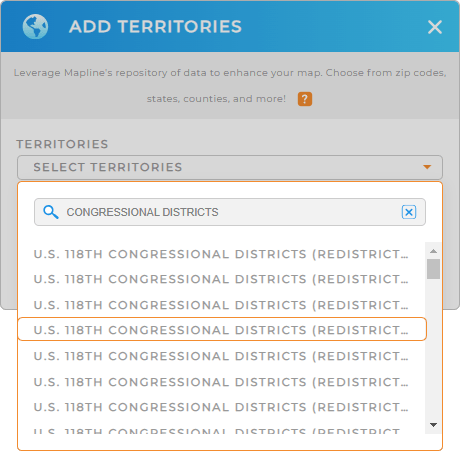
How amazing is that? Just add territories from Mapline’s Repository. Then, in the search bar, type CONGRESSIONAL DISTRICTS REDISTRICTING. It will automatically show all the congressional districts by state. Choose your preferred state, and you’re good to go!


Pro Tip: Mapline’s Repository provides the latest Congressional District boundaries available from the U.S. Census Bureau. Select the most recent year to get the most up-to-date congressional boundaries.
CHOOSE DISTRICT COLORS
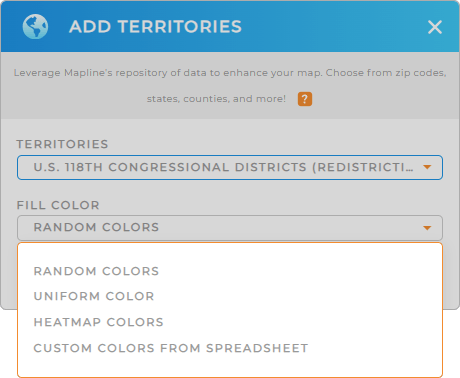
Here’s the exciting part. You now have the control to assign colors to your territories – however you see fit.
Whether you’re analyzing political affiliations, demographic trends, or economic indicators, custom coloring empowers you to extract valuable insights at a glance and make informed decisions for your business or organization.
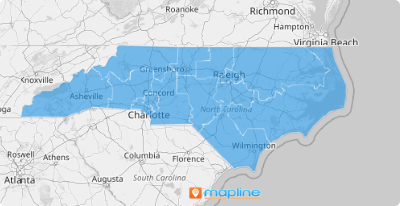
Just select the type of territory color styles you need, and click OK. And there you go! You just created your very own territory map showing the 118th Congressional Districts’ redistricting.

GET NEW TERRITORY INSIGHTS
But it doesn’t stop there! Now, you can:
- Effortlessly sort your data to hone in on the insights you need.
- Narrow down the data in your congressional districts by adding filters.
- Take your analysis up a notch by adding U.S. Demographics to your map.


