U.S. Micropolitan Statistical Areas
- Territory Guide
- U.S. Micropolitan Statistical Areas
Leverage U.S. micropolitan statistical areas on your map and gain invaluable insights into smaller urban markets across the country! These areas offer a prime opportunity to dive into consume demographics and preferences.
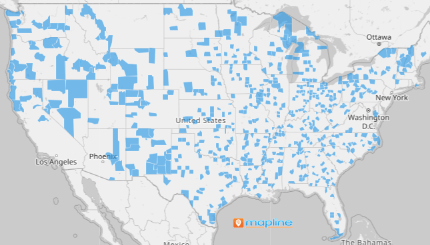
By visualizing micropolitan areas on a map, you can tailor your strategies to better target these specific markets, resulting in more effective campaigns, increased engagement, and ultimately, greater success in reaching diverse consumer segments. Check it out!
WHAT ARE U.S. MICROPOLITAN STATISTICAL AREAS?
USA Micropolitan Statistical Areas are geographic regions designated by the U.S. Office of Management and Budget (OMB) characterized by smaller urban clusters with a population between 10,000 and 50,000 people, centered around an urban core. These areas are measured by economic and commuter activity, making them highly-valuable when it comes to business analytics.
For example, a marekting team might leverage a USA micropolitan statisitcal area map to gain deeper insight into localized consumer demographics and preferences. By understanding the unique characteristics of these smaller urban markets, it’s easier to tailor marketing strategies and messaging to better resonate with the specific needs and interests of residents in each micropolitan area.
A targeted approach like this can increase effectiveness, improve brand awareness, and ultimately result in higher conversion rates. Let’s dive into how it works!
ADD MICROPOLITAN AREAS
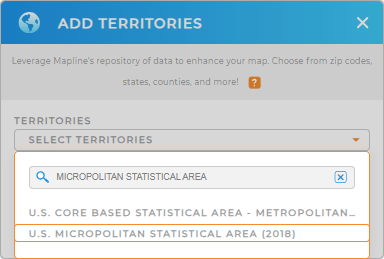
Add U.S. micropolitan statistical areas to your map in a flash! Just add a new territory from Mapline’s repository, then use the searchbar ato look up MICROPOLITAN STATISTICAL AREA.
Select U.S. MICROPOLITAN STATISTICAL AREA from the drop-down menu and you’re all set.
Next, you’ll customize your map appearance.


Pro Tip: Mapline offers the latest micropolitan statisitcal area boundaries available from the U.S. Census Bureau. To add the most recent boundaries, select the most recent year from the drop-down menu.
CHOOSE AREA COLORS
The colors you choose for your territories are for more than just appearance. See the data you need in a single glance with custom fill colors!
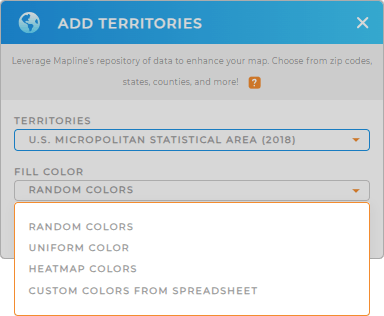
Maybe you want to analyze the economic impact involved in the commuting ties between statistical areas–if so, you’ll want custom colors for each micropolitan area. Or, maybe you want a single, uniform color to make it easier to hone in on other insights.
Whatever you need, just select your preferred color style from the drop-down, click OK, and your map is good to go!

GET NEW TERRITORY INSIGHTS
Now you’ve created your map, amplify your analysis with these powerful capabilities:
- Pull in data from yourexisting datasets and run location-based analytics
- Bring in data from your other territories see how your operations compare to micropolitan areas
- Add population and other demographic data to your micropolitan areas and watch new insights reveal themselves


