U.S. Metropolitan Statistical Areas
- Territory Guide
- U.S. Metropolitan Statistical Areas
A map of U.S. metropolitan statistical areas (MSAs) can significantly impact your analytics with insight into local trends and demographics. MSA maps are invaluable in key business areas like sales targeting, marketing and advertising, and operational efficiency. A detailed MSA map gives you more than just a view—it’s your command center. Instantly spot where your focus should be, prioritize store visits by urgency, and match each location with the right rep to maximize impact. Let’s turn strategy into action!
Here’s how to tap into the true power of territory mapping and unveil new insights that increase ROI and set you apart from the competition.
WHAT ARE U.S. METROPOLITAN STATISTICAL AREAS (MSAs)?
USA Metropolitan Statistical Areas (MSAs) are geographical regions defined by the U.S. Office of Management and Budget (OMB) based on population density, commuting patterns, and social and economic ties. Typically, these areas must have at least 50% of their population living in urban areas of at least 10,000 in population.
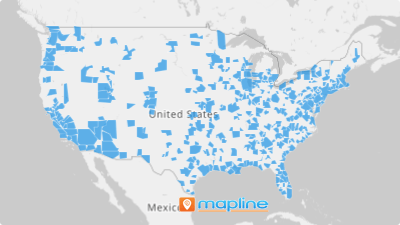
Mapping USA MSAs can provide valuable insights into important business aspects such as market segmentation and target audience analysis. By visualizing MSA boundaries on a map, you can identify high-potential markets, allocate resources more effectively, and tailor sales strategies to specific demographics and consumer behaviors, ultimately leading to increased sales and market penetration.
ADD MSAs TO MAP
A detailed province map isn’t just a nice-to-have—it’s your strategic edge. Instantly spot what matters, uncover hidden opportunities, and catch the critical details that might otherwise fly under the radar. It’s all about smarter moves, faster decisions.
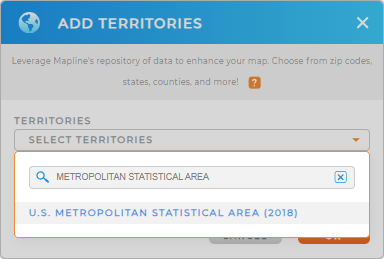
Add U.S. MSAs to your map in seconds! First, you’ll need to add a new territory from Mapline’s repository.
Then, use the searchbar and search for METROPOLITAN STATISTICAL AREA. Select U.S. METROPOLITAN STATISTICAL AREA, then click OK. See? Super fast and easy.


Pro Tip: Mapline’s Repository provides the latest MSA boundaries available from the U.S. Census Bureau. To get the most recent boundaries, select the most recent year from the drop-down menu.
CHOOSE MSA COLORS
Do you want to make your map presentable? Or do you want it to be functional and informative?
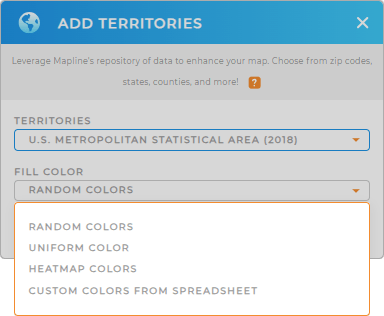
No matter how you plan to use it, adding a custom fill color empowers you to cultivate the functionality you need.
Just select the type of colors you need, then click OK. Now your map is ready to go!

GET NEW TERRITORY INSIGHTS
With a custom MSA map at your disposal, you’re ready to unveil new insights about your brand! Here are some powerful ways to level-up your analysis:
- Bring in data from existing territories and dive into the precise data you need
- Enhance your insights with population and other demographic data
- Leverage heat maps to drive targeted promotions and campaigns


