U.S. Public Use Microdata Areas
- Territory Guide
- U.S. Public Use Microdata Areas
Welcome to the world of PUMA territories! While analyzing your business operations at the state, county, or zip code level is valuable, sometimes you need to zoom in even further to uncover deeper insights. That’s where PUMA territories shine. By focusing on microdata areas, you can gain a wealth of powerful business insights based on demographic factors within these boundaries.
Ready to elevate your analysis and unlock the full potential of your data? Add PUMA territories to your map now and see your business intelligence soar!
WHAT ARE U.S. PUBLIC USE MICRODATA AREAS (PUMAs)?
Public Use Microdata Areas (PUMAs) are a geographic areas created by the U.S. Census Bureau. These areas offer detailed demographic and statistical information at a more granular level than traditional census tracts or counties. Each PUMA contains a minimum of 100,000 people and is confined to a single state, allowing for more precise analysis of population characteristics and trends.
Let’s say you’re a national retail chain looking to expand your service area. By analyzing PUMA maps, it’s easy to identify ideal locations for new stores based on demographic data, such as population density and income levels. This enables more targeted expansion efforts, maximizing customer reach and profitability.
ADD PUMA TERRITORIES
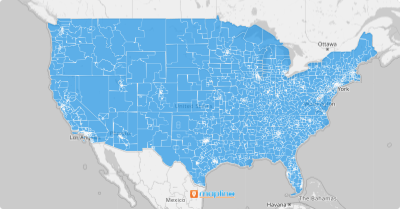
Add U.S. PUMA boundaries effortlessly! With just a few clicks, you can plot PUMA boundaries onto your map. This simplifies trend analysis, custom sales territory mapping, and more!
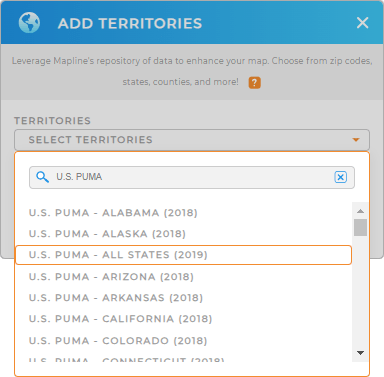
First, add a new territory from Mapline’s repository. Then, type PUMA in the search bar and you’re good to go!
You have the option to add PUMA boundaries by state or apply them all over the country.


Pro Tip: Mapline’s Repository offers the latest boundaries available from the U.S. Census Bureau. Click the most recent year to add the most recent boundaries.
CHOOSE PUMA COLORS
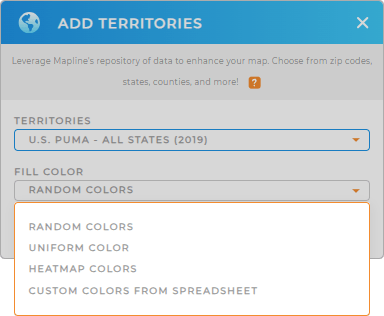
Select the fill color style for your PUMA map. Make it vibrant with random or uniform colors, or personalize it to match your brand. You can even apply heat map colors for added impact!
For the best results, reference our color styling cheat sheet.
Whatever you prefer, we’re here to guide you. In fact, this is your
Go ahead! Impress your audience with a captivating PUMA map.

GET NEW TERRITORY INSIGHTS
With your U.S. PUMA map, you can now:
- Analyze education levels of the population by leveraging U.S. Demographic data.
- Filter your customers to understand their different buying needs.
- Utilize heat maps for risk reduction planning and management.


