Quick Reference Guide
Maps: Shapes
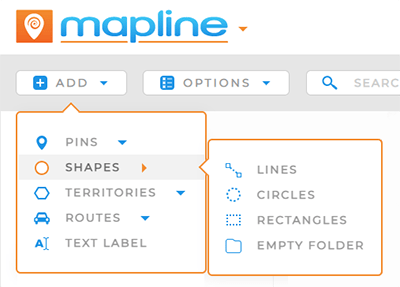
SHAPES
Draw lines, circles, or rectangles wherever you need them on your map.
Lines are ideal for measuring distances or displaying relationships between map points. They also give you the power to draw custom territory shapes wherever you need them.
Rectangles are great for creating a static shape or coverage area around a location on your map. If you want territories that fit together seamlessly, rectangles are the perfect shape.
Circles are the best way to see which areas have enough coverage, where you have overlap, and which areas don’t have coverage at all. Plus, circles empower you to visualize the radius around your pins!
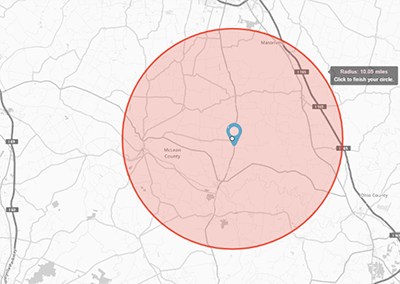
DRAW SHAPE
Click the map once begin your shape. As you move your mouse, the shape grows. Watch the distance in miles that appears in the black label next to your shape. This acts as a guide for how large the shape is on your map.
Once you have the right distance, click your mouse again to complete the shape.
Draw as many shapes as you need in one go. Once you click Done, this series of shapes becomes its own Layer Folder in your map sidebar.
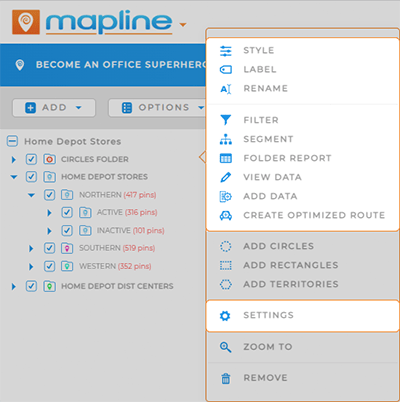
CUSTOMIZE SHAPES
Customize your shapes to get the most use out of them. For example, label your circles with the mile radius you drew, so you can always see the radius at a glance. Or, color-code your shapes based on team territories and assignments.
Right-click the Layer Folder menu to style, label, rename, filter, or segment shapes.
From this menu, you can also view your folder report, view data within your shape, and even create optimized routes from the data within your shape.
Customize your shape behavior and appearance through your layer settings.
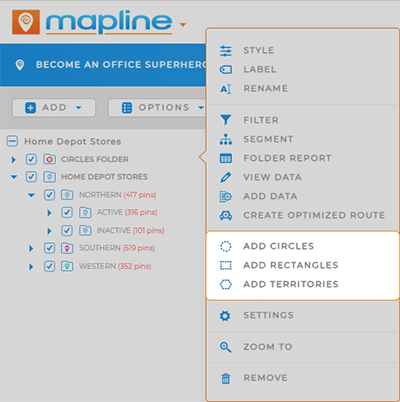
ADD MORE SHAPES
Did you miss a shape, and want to include it in a specific Layer Folder?
Right-click the shapes layer folder in your sidebar menu and select Add Circles,
The new shapes or territories will be added to the folder you clicked on, giving you the versatility to customize your map layers as needed.
Pro Tip: Adding shapes and territories to your existing layer folders prevents clutter in your sidebar! Otherwise, you end up with a new layer folder every time you add shapes to your map.