How to Create a Map with Segments
Group Pins on Your Maps for Better Insights
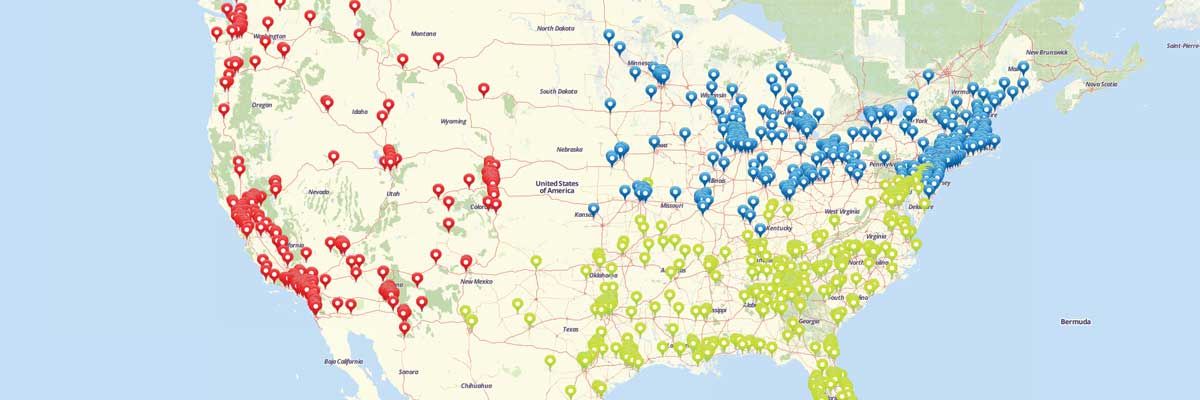
Specifying locations with pins helps you identify trends and outliers, but what if you’re looking at too many locations at once? All that data viewed at once can get confusing and start blending together. With the segment feature, you can categorize your pin segments and narrow in on what you actually want to look at. Follow our step-by-step instructions to add segments to your maps where you can visualize customer segments, location types, regions, and more.Steps to add Segments to your map
- Create a new map and add a dataset on your map.
- Click layer options menu next to the layer on your map.
- Select the “Segment” option.
- Click the “Add tier of segments” button.
- Select the category from your Excel spreadsheet that you would like to use as categories on your map.
- Click Done.
That’s all it takes to group your pins and assign different icons for different groups of locations!


