
Make Your Cote d’Ivoire Districts Map More Than Just a Stunning Visual
Make an Impact Out of Your Map with District Boundaries
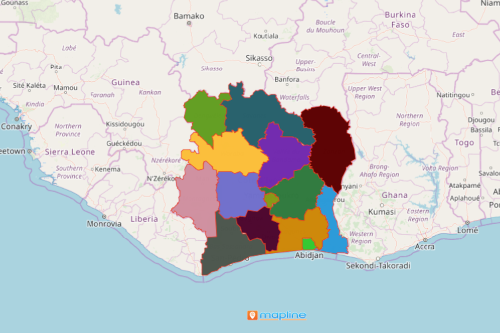
While it is a stunning visual, a Cote d’Ivoire districts map can be more than that. In fact, it can turn data and territories that tell stories relevant to your analysis, planning, and decision-making. How? One way is to plot your Excel data. But first, let’s take a quick look at the country and its administrative boundaries. Cote d’Ivoire is a West African country that is divided into 12 districts and 2 autonomous cities which also function as a district. The districts are further divided into 31 regions and even sub-divided into 108 departments and 510 sub-prefectures.
It takes only a minute to upload your Excel data on a Cote d’Ivoire map showing districts. You have a choice of dropping pins one-by-one, or plot pins in bulk by uploading your Excel spreadsheet. Then, use advanced mapping tools such as heat mapping, map customization, or pin customization to make your map stunning yet insightful. Once you’re on the roll, you will realize that data visualization has never been this awesome!
10 Steps to Create in 60 Seconds
Mapline makes it the easiest to create a Cote d’Ivoire map of districts so that you have ample time using more powerful tools for your analysis. In fact, it only takes 10 simple steps to start mapping:
- Create a Mapline account and login.
- Click the orange “Add New Items” button.
- Select “New Map” on the drop down arrow.
- Give your map a name and click “OK.”
- Click the “Add” button from the left sidebar.
- Select the “Territories” option.
- Click “From Mapline’s Repository.”
- From the “Territories” select “Cote d’Ivoire Districts.” Use the search bar for quicker results.
- Select how you want your boundaries to be colored in “Fill Color” (Random Colors, Uniform Color, Dynamic heat map colors, or Custom colors from spreadsheet).
- Click “OK.”
That’s how easy it is to create a Cote d’Ivoire districts map! Mapline also makes it simple to see summary information about the locations inside each district just by clicking on them. Sign up now!