CANADA AGRICULTURAL REGIONS
- Territory Guide
- CANADA AGRICULTURAL REGIONS
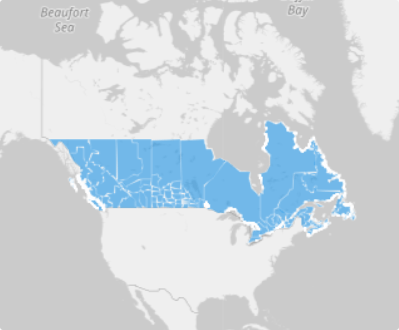
Adding Canada’s agricultural regions to your map can significantly elevate your analysis. By overlaying these regions onto your Mapline map, you gain access to valuable insights into agricultural boundaries, facilitating better decision-making and strategic planning.
Imagine a map without a territory. It’s like bread without butter! Your map makes more sense with territories. Plus, territories empower you to instantly see regional patterns in your data. So, let’s get started!
WHAT ARE CANADA AGRICULTURAL REGIONS?
Canada is one of the world’s largest agricultural producers and exporters. Census agricultural regions (CARs) in Canada are groups of adjacent census divisions. There are 82 census agricultural regions that serve to support spatial analysis and thematic mapping of data gathered from the Census of Agriculture 2011.
Various factors affect the agricultural regions including:
- Agricultural engineering (farm machinery and equipment)
- Farm capital
- Operating expenses
- Type and quantity of farms
Elevate your analytics to the next level by seamlessly integrating these boundaries. Unleash powerful insights, transform complex details into game-changing strategies, and fuel innovation like never before. It’s time to redefine what’s possible!
ADD AGRICULTURAL REGIONS
Add these boundaries today for enhanced visualization and smarter decision-making, empowering you to craft winning strategies and drive unstoppable business success!
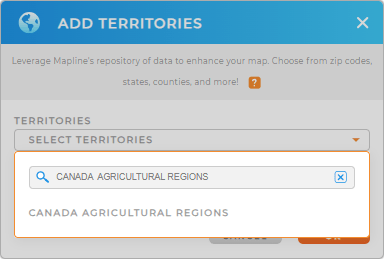
You can quickly add Canada’s agricultural regions to your map. First, add a new territory from Mapline’s repository. Using the search bar, type CANADA AGRICULTURAL and select CANADA AGRICUTLTURAL REGIONS.
From here, Mapline does the heavy lifting so you don’t have to. There’s only one more quick step before you’re done.


Pro Tip: Mapline’s Repository of extensive territory boundaries give you the power to map with precision, uncover hidden opportunities, and make smarter decisions. Supercharge your market analysis and transform insights into action when you add Canada boundaries including agricultural regions, Canada census tracts, Canada designated places, or Canada forward sortation areas.
CHOOSE REGION COLORS
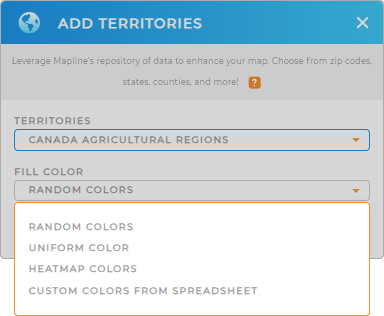
It’s never been easier to color-code your map territories! Adding colors to your territories makes it easy to identify growth opportunities, analyze demographic trends, or track your sales performance in a glance.
Just select the type of colors you’d like to use, then click OK. And that’s it–you’re all set.

GET NEW TERRITORY INSIGHTS
Now, you can start applying these awesome next steps to your map:
- Share this map to ensure your team stays in the loop
- Leverage filters to hone in on snapshots of your data and identify trends
- Compare and contrast over-served and under-served areas with heat maps


