
Know Your Customers Better with a Moldova District Map
Use a District-Level Map for Customer Profiling
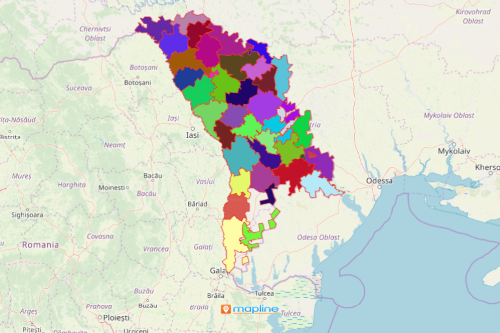
A Moldova district map is used to determine the needs of customers based on factual information. Knowing where your customers are may be a painful task. However, when powerful mapping tools are used, customer profiling turns out to be an easy process. Moldova is a country nestled in Europe. It is divided into 32 districts. Moldova is known for producing liqueurs and sparkling wines.
An overlay of district boundaries on a map produces a string of insights. These insights are used to identify customers’ needs. The map is a powerful data visualization that magnifies the strengths and opportunities of each district. It directs to areas that may be tapped as potential markets. It also shows areas that are frequented by customers. For that reason, a district-level map helps to get to know your customers better.
Map District Boundaries to Identify Customers’ Needs
True, customers are a core of the business. Therefore, understanding the customers through mapping is highly important. It is a good thing that creating a map with district boundaries takes only a few seconds:
- Create a Mapline account and login.
- Click the orange “Add New Items” button.
- Select “New Map” on the drop down arrow.
- Give your map a name and click “OK.”
- Click the “Add” button from the left sidebar.
- Select the “Territories” option.
- Click “From Mapline’s Repository.”
- From the “Territories” select “Moldova Districts.” You can also enter that on the search bar.
- Select how you want your boundaries to be colored in “Fill Color” (Random Colors, Uniform Color, Dynamic heat map colors, or Custom colors from spreadsheet).
- Click “OK.”
Indeed, identifying the customers needs always results in customer satisfaction, commitment, trust and loyalty. So sign up now to get started with your market research and customer profiling through mapping!