
ANALYZE COMPETITORS AND MARKET FOOTPRINTS
- How To Guide
- ANALYZE COMPETITORS AND MARKET FOOTPRINTS
If you can’t see where your competitors are lurking on the map, it can feel like trying to spot the Green Goblin in a dense fog.
And when it comes to understanding market saturation, competitor distribution, plus gaps and opportunities? That’s as complicated as figuring out the Kingpin’s next move. You need clarity on every factor at play and transparency into every move your team makes.
It’s time to tap into your Spidey-sense and gain an instant laser focus on competitor proximity, market share, and even street traffic data around competitor locations. Then, assess how attractive these spots are to different customer segments, generating quick intel that keeps you ahead of your rivals.
Easily spot trends and patterns in your data. Track competitors, analyze their impact, and identify market opportunities effortlessly–all with the best geo-intelligence software in the world. Here’s how to get started!
CREATE INSTANT COMPETITOR MAPS
Get a clear overview of your competitors on a map! Instantly visualize competitor locations, eliminate blind spots, and ensure you understand your market environment thoroughly.
Here is some data you may want to include in your competitive analysis:
- Competitor distribution centers
- Competitor addresses
- Competitor sales data
- Planned competitor expansion areas
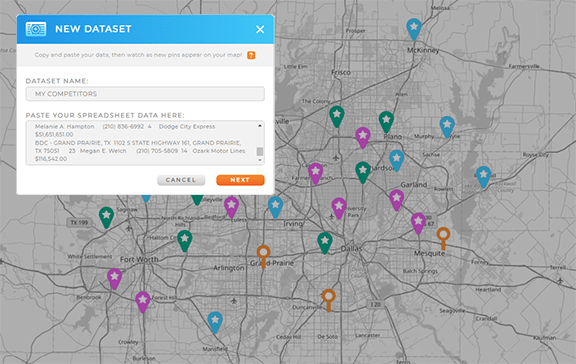
Once you’ve compiled this data, open your customer market map and click the ADD menu. Hover over PINS and select FROM SPREADSHEET. This function allows you to quickly add a new dataset containing your competitor locations, and automatically adds those locations to your map.
Name your new dataset COMPETITOR LOCATIONS, paste in your competitor location data, then click NEXT. Confirm your address data imported correctly, then click OK.
Now all of your competitor locations are on your map! Let’s review some powerful ways to analyze these locations and learn more about your rivals.

Pro Tip: Already have competitor data stored in another program? Mapline’s API and Connectors allow you to seamlessly share data between your systems and ours, giving you the data you need on demand.
ANALYZE COMPETITORS BY PROXIMITY
Analyze how close your competitors are to your business locations! This helps you gauge potential competitive threats and opportunities and empowers you to make informed decisions about market expansion and defense strategies.
We’ll achieve this by adding a new Mapline Data column to your competitor dataset. This column will include distance data between your business locations and your competitors.
Simply click the map pin layer containing your business locations and select ADD MAPLINE DATA. Name your new column DISTANCE TO NEAREST COMPETITOR. For the source data, select ANOTHER DATASET FROM MY LIBRARY, then choose the dataset in your library that contains your competitor locations.
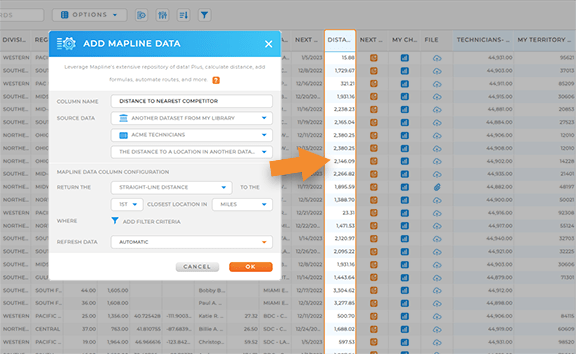
Select THE DISTANCE TO A LOCATION IN ANOTHER DATASET, then configure your Mapline Data column to return the straight-line distance or drive distance to the nearest competitor location. Choose your units, apply any necessary filters, then click OK.
Now, a new column appears in your dataset listing the distance to the nearest competitor for each of your business locations! This is a powerful way to begin understanding how distance impacts your business.

Pro Tip: Easily generate territories around your pins for even deeper analysis! Territories give you the power to analyze your competitors within a given mile radius of your stores or customer hotspots. This is a robust method for regional competitor analysis, which is covered below.
ADD CUSTOMER DEMOGRAPHICS
By overlaying customer demographics—such as income levels and household compositions—onto your map, you can identify customer hotspots and ensure your messages resonate effectively with the right demographics. (Plus, this step will come in handy later when we look at market saturation).
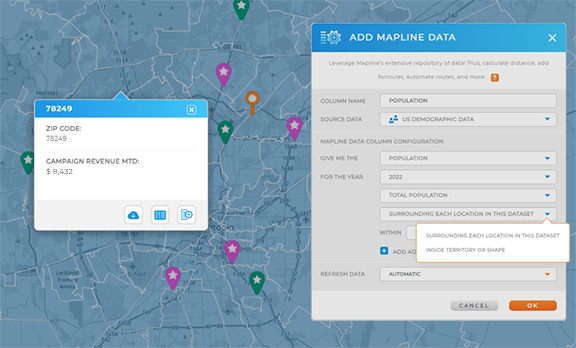
Click your map pin layer or territory layer and select MAPLINE DATA from the pop-out menu. Name your new dataset column POPULATION. Then, click the SOURCE DATA drop-down and select U.S. DEMOGRAPHIC DATA.
Select POPULATION as the calculation type, then customize your demographic data configurations. When you’re done, click OK.
Depending on the number of rows you’re processing, it could take a few minutes for the data to populate. In the meantime, you can repeat this step if desired to add any of the following demographic data points to your dataset:
- Number of Households: Total count of homes in an area
- Average Household Income: Median income of households in an area
- Number of Dwellings: Total housing units in an area
Once you’re done customizing your demographic data, let’s review how to gain new market insights when you compare competitor data to your business data.

Pro Tip: Mapline Data is a powerhouse for your analytics. Leverage it to run advanced calculations that unveil new insights about your brand; add rich data to your datasets and visualizations; or enhance your map with government and administrative boundaries in a flash.
ASSESS MARKET SATURATION
Now, let’s visualize your competitor density, giving you clarity on market saturation and untapped opportunities. This helps you pinpoint new markets or refine your approach in existing ones, optimizing your overall market penetration strategy.
We’ll leverage Mapline Data again to calculate key metrics that help you understand your competitor’s market saturation and how you compare.
First, let’s determine how many competitor locations there are per 1,000 people in each market area. Click the map territory layer you’d like to analyze and select MAPLINE DATA from the pop-out menu.
Name your new Mapline Data column COMPETITOR DENSITY, select A DATASET FROM MY LIBRARY, and choose your competitor dataset as the source data.
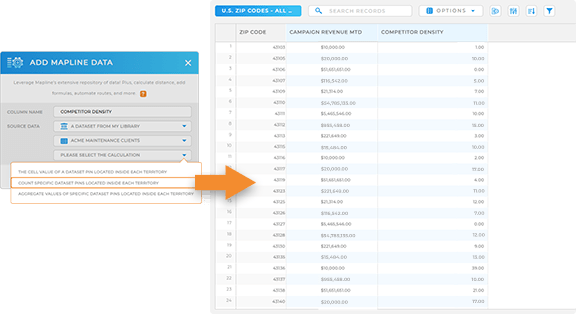
Select COUNT SPECIFIC DATASET PINS LOCATED INSIDE EACH TERRITORY to count the number of competitor locations in each territory. Apply any necessary filter criteria, then click OK.
Now, your dataset has a new column that lists the number of competitor locations inside each territory! You can click each territory on your map to see this information at any time!
Alternatively, repeat the process and add a new Mapline Data column to THIS DATASET. Select CALCULATE A VALUE FOR EACH ROW IN THIS DATASET USING A FORMULA and determine the number of competitor locations per 1,000 people in each market area with the following formula:
Competitor Density = (Competitor Locations / Population)*1000
You can even run additional Mapline Data formulas that help you understand market saturation, such as:
- Calculate the number of your business locations per 1,000 people within each market area: Business Density = (Number of Locations / Population)*1000
- Calculate the total sales per person within each market area: Sales Per Capita = Total Sales / Population
- Understand saturation levels when you compare the total number of business locations per 1,000 people in each market areas: Market Saturation = (SUM (Your Locations + Competitor Locations) / Population)*1000
Once you’ve run these calculations, compare these metrics to industry benchmarks for market saturation. This is an effective way to analyze how your brand compares to the industry standard.
COMPARE MARKET FOOTPRINTS
Now that you’ve determined your market share and assessed market saturation, you’re ready to compare your market footprint with your competitors!
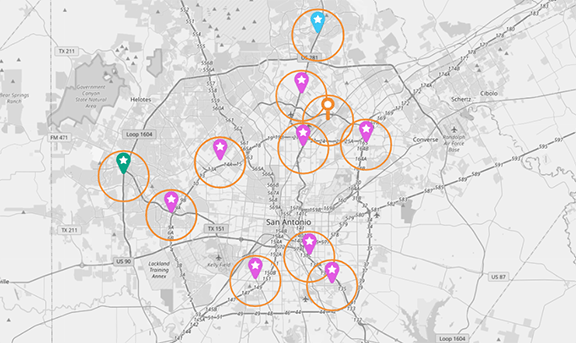
Create heat maps that show areas of high and low market saturation, use coverage areas to visualize overlap areas and regions where a competitor might dominate, or add more demographic layers to see how market footprints align with target customer segments.
For example, if you know your customers are only willing to drive five miles to reach one of your stores, add coverage areas around each of your stores and your competitors’ to see which competitors could be taking foot traffic from your store.
By comparing market footprints with these visual tools, you gain valuable insights into market saturation and customer demographics. This empowers you to make strategic decisions on where to expand or pull back, ensuring you stay ahead of the competition and maximize your market presence.
STAY AHEAD OF THE COMPETITION
In today’s competitive landscape, staying ahead requires agility and foresight. Get real-time insights and dynamic analysis tools that empower you to monitor competitors, track market trends, and adapt strategies swiftly. This proactive approach ensures you remain a step ahead in your industry.
Here are some powerful ways to take your data analytics to the next level and increase your bottom line:
- Track customer engagement in real-time to stay agile and responsive
- Define and monitor KPIs that are critical to your campaigns and performance
- Create and manage sales territories to optimize coverage and resource allocation
- Seamlessly integrate your visualizations with other programs to consolidate data and ensure up-to-date information


