Close
WE'RE ALL ABOUT
YOUR
SUCCESS
HOW WOULD YOU LIKE TO GET IN TOUCH:
Email
Email
Calendar
Cal
Close
WE'RE ALL ABOUT
YOUR
SUCCESS
HOW WOULD YOU LIKE TO GET IN TOUCH TO SCHEDULE YOUR DEMO:
Email
Email
Calendar
Cal
Mapline - mapping made powerful Close
Give us a call. We'd love to talk!

+1 800.969.1454

Close
Close
Geo Mapping Starter Close

Experience the power

Get ready to see your data in a whole new way!

How to Create a Map

Maps empower us to see the world—and our data—with fresh eyes and an open mind. Whether you need to map geographic data to perform high level marketing analyses, plan an optimized sales route or anything in between, Mapline has simple tools for the job.

5 Benefits of GIS for the Retail Industry

For many retailers, the challenge is the same: location. Geography matters, especially in a hyperconnected world, where the rise of ecommerce means physical stores must craft a bigger and better in-store experience. With maps, retailers gain a competitive advantage. Placing your business data on a map is not only key to visualizing your market, but also understanding it. Let’s take a closer look at five ways GIS mapping benefits retailers.

1. Find Your Site

The wrong location can greatly impact your business’ success, no matter how compelling your product or service. GIS mapping can help retailers determine what type of site is right for their store. Mapping and evaluating for retail site selection involves considering many factors that will help drive sales—from consumer demand and traffic patterns to local populations and much more. A retail market mapping tool gives retailers the power to store, quantify, visualize, and manage site data in order to avoid a potentially poor location.

2. Identify Your Competition

Knowledge is power. And with GIS software, retailers understand exactly where competitors are in relation to their own facility. Competition mapping with GIS moves beyond the spreadsheet and offers a visual representation of nearby competitors, the products and services they offer, their hours of operation, marketing tactics, and more. GIS gives retailers a clear, visual understanding of what is happening in their market, arming them with insights that can drive product development, promotions, and customer loyalty in the face of competition.

3. Analyze Customer Demographics

Understanding your customers and their shopping decisions is crucial to increasing profitability and launching new strategies. To make the most of GIS mapping capabilities, retailers first need basic customer information, such as name, address, postal code, and products purchased. Next, retailers can link this commonly collected data to geographic information using GIS mapping. Not only will you be able to draw insights from location-based demographic data, but also plot profitable customer groups and learn more about lifestyle behaviors.

4. Manage Delivery Routes

A powerful tool for optimizing fleet management, GIS can better inform schedule requests, arrival and departure times, customer sites, and many other facets of supply chain management. Bring complex data to life with mapping analysis, and connect the dots for shipping and delivery processes.

5. Launch Targeted Marketing Campaigns

Retailers who leverage GIS can craft multidimensional representations of customer likes, dislikes, purchasing trends. Analyzing patterns in your market is an essential step in communicating with customers through effective marketing. Using spatial analytics in retail allows you to plan marketing personas and strategies, innovate with new media, and launch direct mail campaigns. Mapping software reveals a world of vital information to retailers, from demographic profiles to nearby competitors, and more. By visualizing information with GIS mapping, retailers can better interpret data, improve decision making, and enhance communications. Learn more about GIS mapping and how you can leverage it for your own business.

Export Printable Maps

Get printable maps for presentations

Export and print maps right from Mapline! With a few clicks, you can export images the size of your screen or even blow them up to 4 times the size of your screen for enlarged printing. There are three image sizes:
  • Regular – Creates a map that is the size of your screen.
  • Large – Creates a map that is double the size of your screen.
  • Extra Large – Creates a map that is four times the size of your screen.
Naturally, the higher the zoom level the more detailed the map will be. Meaning the Extra Large map will be the most detailed map, but will also be a much larger image than the other two. To see exactly how the map would look printed, make sure to view the downloaded image at the 100% zoom level.

Steps to export a map

  • Open your map in Mapline
  • Click on “Options.”
  • Click on “Save as Image.”
  • Select what you want to export (Map or Sidebar)
  • Select the image size you want
Ready to learn more about building and creating maps with Mapline. Click the button below to see our plans and pricing page.

Learn More

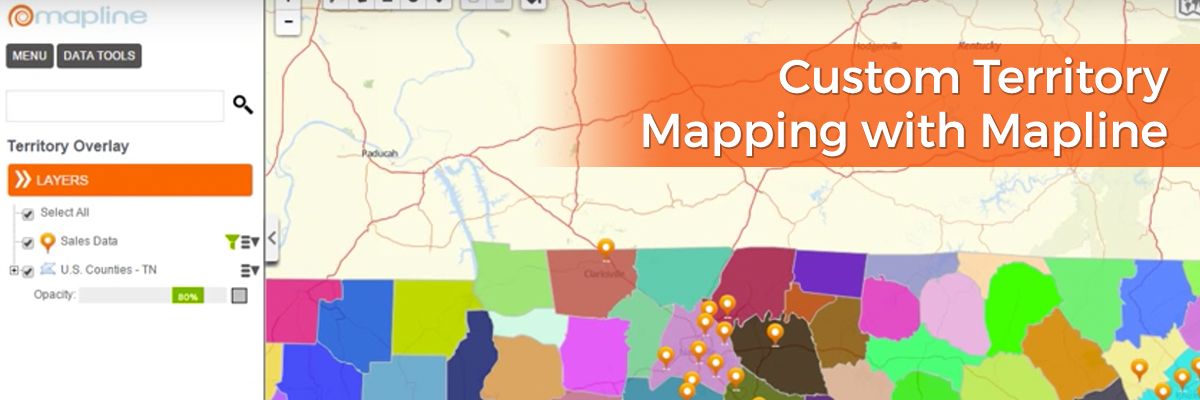
Custom Territory Mapping with Mapline

Mapline offers a lot of fantastic features to help you analyze your Excel location data. One of these features is territories. With Mapline, you have the option to use a multitude of existing territories as well as creating custom shapes on your map. Want to understand the advantages of each of these methods? We’ve got you covered.

Available Existing Territories – How to Use Territory Mapping Software

Mapline offers territories for dozens of countries, from Afghanistan to Zimbabwe and everything in between. You’re able to select your chosen country or continent and narrow down from that level. Examples of existing territories include: Australian local government areas, postal codes, states and territories and suburbs; China provinces; UK counties, countries, postcode areas, postcode districts and regions; and US zip codes, Census tract maps, congressional districts, area codes and school districts. Find a full list of Mapline’s available territories here. As you can see, territories vary widely. Using our existing territories is best when you want to analyze your company’s location data in relation to your customers’ own lives and reality. For example, if you want to understand demographic factors associated with customers, you might plot customer addresses and overlay a territory as broad as states or as granular as US Census tracts to view distinct groups of populations and analyze their behavior.

Draw on a Map for Custom Map Making

If, however, you wish to analyze data based on your company’s own indicators, you can use our custom territory mapping to draw a circle on a map (or square or other shape – including irregular shapes) to represent your internal boundaries or delineated sales territories. You’re also able to click on your shape to then see a list of all the addresses located within the shape. This feature is especially helpful for analyzing sales territories to determine reps’ workload and distribution of both clients and sales personnel. And there you have it – when to use existing territories and when it’s best to draw on a map to create your own custom shapes. It’s that simple! Want to know what else you can do with Mapline? Browse our features.

Measure and Export Distance Between All Locations in Two Datasets

Simple distance analysis

Mapline is making it a whole lot easier for you to find out exactly how far apart locations are. You can easily add two datasets to Mapline and then export the straight-line distance between all locations in both of these datasets. Once downloaded, the Excel spreadsheet will contain the 2 datasets that you chose. The first one is along the side as rows, while the second dataset goes along the top as columns. The distance between any two locations is shown where the column and row intersect.

Steps to measure and export the distance between all locations in two datasets

 
  1. Open your map.
  2. Click “Tools.”
  3. Select “Distance Grid.”
  4. Select the two datasets and your preferred units.
  5. Click the “OK” button to export the distances between all locations in datasets (A) and (B).
Ready to discover how easy it is to map the distance between two locations. Click the button below to get started

EMBED A MAP ON YOUR WEBSITE

Easy Steps to Embed a Map

Within seconds you can embed a map on a website with Mapline, and it’s just as easy as a YouTube video. Simply click Menu and select the Embed button. This will generate the code for you to paste into a webpage’s source code. Note that you will need to make your map public to embed a map. This simply means that anyone with the URL can access your map.

Embed a Map On Your Website with Mapline Mapping Software

When you insert a map on a website, you gain space to explain your map in more detail – how you gathered your data, where your map fits into a bigger vision, etc. You can also seek comments or feedback, which can be particularly useful when you are using a map for planning purposes. Gain input and insight from team members with different perspectives and use this when making important decision. You can also configure the map size for the best fit on your site and indicate whether you would like to show the left sidebar or not.

Steps to embed a map on a website

  1. Open your map.
  2. Click on the MENU button and select the “Embed” option.
  3. Check the box indicating that you are aware that your map will be publicaly available
  4. Copy and paste code shown on the box into your website
Mapline makes it that easy to embed a map on your  website. Mapline makes it that easy to embed a map on a website. Sign up now to give it a try!