How to Map Sales Territory Reports
Increase Visibility into Your Sales Performance
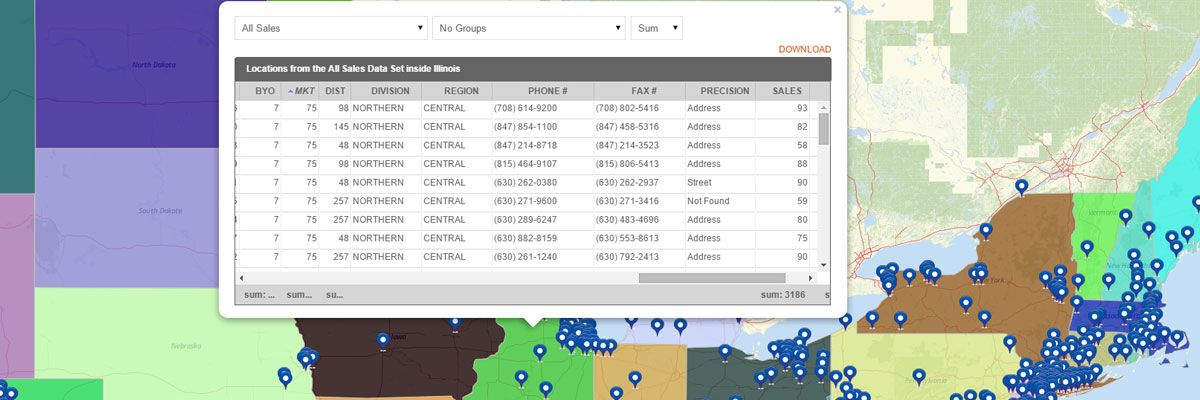
Sales territory reports provide full visibility into your sales performance you don’t get when looking at numbers in a spreadsheet. Sales summary maps created with our territory mapping software include:- Measurements – the shape of the territory, number of sides, area, and center coordinate
- Summary of All Data – summary of all data sets inside the territory which include name, location count, midpoint, and center of minimum distance. If you have sales numbers in your pins, then you can see the total or average sales for each territory.
- Export option – to download the territory report.
Steps for How to Create a Sales Summary Map
Creating a sales summary map is easy. Just build your map and place your sales data pins on the map. Then, overlay the territory you would like to view. To access the territory report:- Hover your mouse to a specific territory and click it.
- Your territory report will appear.
- Click the “Download” link.
That’s how easy it is to see territory performance reports! You can also create a heat map of your territories to visualize the performance.
Start Mapping Today


