The first time I was ever asked to make a map, I just didn’t get the point. I could hold everything I needed in my spreadsheet. Why plot a bunch of dots on a map? Little did I know… there are some pretty sweet treasures found within maps!
What’s Mapping All About
With the growth of technology, mapping has transformed into a far greater tool than just dots on a wall. Most customer presentations contain maps, and businesses identify growth opportunities once they can see their options and assess the competition. Strategies are enhanced with the ability to visualize information and interact with the click of a button. Mapping is a powerful tool to perform visual analysis,
create dynamic reports, and deliver compelling presentations. And what business would want to pass that up?

Why Build Maps?
Let’s role play a customer presentation. The PowerPoint is on the screen with the same performance recap slides that were used last time–only updated. We’ve done this before. Several times. Next comes the pitch to grow business… Compelling? Well… perhaps. Or boring. Now let me walk you through another scenario where maps are used to be more compelling. Perhaps the presentation dialog would go something like this:
“[Click] Here are our manufacturing plants…” “[Click] Here are your distribution centers and retail locations…” “[Click] And here are your distribution centers within 25 miles of our plant which we don’t currently supply… Let’s focus on Atlanta.” “[Zoom to Atlanta] You have 36 locations in Atlanta, and we would like to trial supplying 5 of your sites with product. During the trial, we will create a disaster recovery plan which will give you security of supply.” “[Zoom Out to see Southeast US] We have two other manufacturing plants within 200 miles of Altanta which can supply product in case of a disruption in our Atlanta plant. Additionally, since our production facility is within 25 miles of your distribution center, we expect to save you $1.5 million in transportation costs for this trial period.” It’s all about data visualization to simplify business. Anytime I meet with a client, their first response is how impressed they are with how well I know their business… Then they ask for a copy of the map. Mapping is instrumental to identify growth opportunities–even in markets which are perceived to be exhausted. You become a hero. Congratulations.
How to Make Spreadsheet Data Awesome
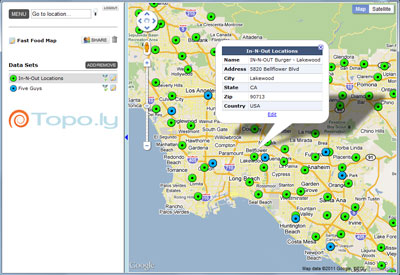
We’ve tried to make it simple. In fact, we tried to make it so simple that even our mom could do it… It really comes down to a two step process. Copy your spreadsheet data (along with any columns of data you would like to filter on) and paste it into the
mapping tool. Then click “View My Map!” It’s that easy. Within minutes you will have an incredibly powerful tool to enhance your business. Mapping has transformed the way we do business. It assists with building product rollout strategies; it give perspective to customers during sales presentations; it highlights competitors; it gives visualization to otherwise boring spreadsheet data.
Begin Mapping Now to get started building your own visual solution!


