Close
WE'RE ALL ABOUT
YOUR
SUCCESS
HOW WOULD YOU LIKE TO GET IN TOUCH:
Email
Email
Calendar
Cal
Close
WE'RE ALL ABOUT
YOUR
SUCCESS
HOW WOULD YOU LIKE TO GET IN TOUCH TO SCHEDULE YOUR DEMO:
Email
Email
Calendar
Cal
Mapline - mapping made powerful Close
Give us a call. We'd love to talk!

+1 800.969.1454

Close
Close
Geo Mapping Starter Close

Experience the power

Get ready to see your data in a whole new way!

Author: Mapline

Using Radial Heat Maps

Visualizing Your Data with a Geographic Radial Heat Map

Radial heat maps look like weather radar and show color coded concentrations of your data. With radial mapping software options you’re not only able to visualize your data on a map but you can also easily and immediately understand where the majority of your activity is located. By presenting more densely populated areas in one color and sparser locations in another from the gradient, Mapline makes analysis of your data simple, whether you’re mapping customers, sales or other calculations from your spreadsheet. You can view heat map overlays with your data pins and you’re also able to hide the pins for a clearer picture.

Steps to overlay a radial style heat maps

  1. Open your map.
  2. Click the drop down menu next to your dataset.
  3. Select “Heat Map.”
  4. Select whether you would like to apply the heat to the area around the pins or the overlapping radius areas.
  5. Define the radius (miles or kilometers).
  6. Select whether you would like the heat map to be based on location density or the sum or average of your data.
  7. Click on the “Styling” tab to set the opacity and blur. You can also remove the legend and fade the edges of the heat map.
  8. Click “OK.”
If you want to hide the map pins so you only see the heat map, here’s what you can do:
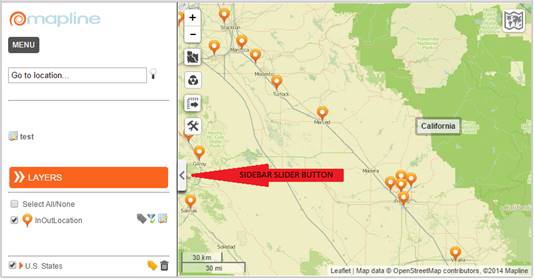
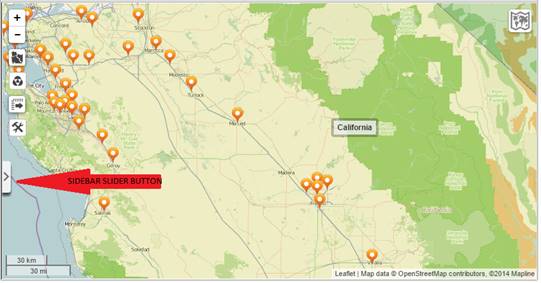
  1. Click the pin icon on the left sidebar.
  2. Select “Style.”
  3. Select the “Hide Pins” option at the top right.
Ready to use our radial mapping software? Check out our plans and pricing to find the right option for you.

How to Share a Map

Trying to share files through email chains becomes confusing and disorganized. What if you’re sending multiple versions of data sets, and your colleagues or clients happen to open an older version? After you create a map with Mapline, you can also share those maps in real time with your teammates, colleagues, clients, and customers. No back-and-forth emails, no tracking down the “latest copy,” and no special software or downloads are required! Follow our step-by-step instructions on how to share a map online.

Steps to share a map

  1. Open your map.
  2. Click “Options.”
  3. Select “Share.”
  4. Enter the email address of the person with whom you would like to share your map.
  5. Click “Share.”
  6. Select if you would like to share the dataset information with that person.
  7. An email will be sent to the user inviting them to sign in to see the map you have shared with them. If they are not a registered user, they will be required to register using the same email address as the one you shared your map with.
  8. Add more email addresses if you want the same map to be shared to more recipients.
That’s how easy it is to share a map with your team. Just enter their email and let them enjoy the map themselves. Sign up now to give it a try!

How to Create a Color-Coded Map

Add Multi-Colored Territory Boundaries to Your Maps

Creating a map that is color-coded allows you to distinguish your territory boundaries and see trends you may not have been able to before. Take an example of viewing a map of the United States. You want to better distinguish your territory boundaries, but how? Just use our color-coded feature to group states by different colors to make your boundaries stand out and help you gain deeper insights about your territories.

 Follow our step-by-step instructions to make a color-coded map from Excel data.

Steps on How to Make a Color-Coded Map

  1. Open your map.
  2. Click “Add.”
  3. Select “Boundaries.”
  4. Select the boundary you want to add to your map.
  5. Choose “Paste Colors from a Spreadsheet.”
  6. Click “Download a Sample Spreadsheet.”
  7. Open the template in Excel. You’ll see the shape name in the first column and the color you would like it to appear in the second column. Make any updates you need in the spreadsheet. Delete any rows of shapes you don’t want to appear on your map.
  8. Copy and paste the updated spreadsheet into Mapline. Be sure to include the column headers (Shape Name and Color)
  9. Click “OK.”

View Our Mapping Software Plans

Mapline offers a wide range of territory boundaries which can be added to your color coded map. Check out Mapline’s Available Territories to see what is offered as well as step-by-step instructions on how you can add them to your map or build heat maps with territory colors.

Mapline’s Even Better with Improved Mapping Features

Hello there Mapliners! We have some awesome news for you! Over a couple of weeks, we were able to make some improvements on the mapping features and designs for better user experience. Here are some of the latest improvements we’ve added:

Faster mapping

Mapline users can now enjoy faster mapping with Mapline. Now map page loads while datasets and polygons are loading giving a better user experience. Also, data sets now loads faster. Loading improved up to 40% faster for larger data sets. Better map performance on zoom out levels with larger data sets.

HTTPS security

We’ve added new security features in all our users – Free, Plus, Pro, and Enterprise. The https will increase the security of your maps and data. With the new https security at all levels of membership, Mapline provides an added boost of confidentiality.

Sidebar toggle

Users can now enjoy hiding and showing the left side bar with the new user-friendly sidebar slider.

Mapline’s Got Another Facelift!

Smart. Chic. Impressive. No, we’re not describing a new line of fashion. We are talking about the new look of Mapline. As we provide the easiest mapping tools in the planet, we’d like our users have the same feel as they create maps one after another – simpler and better! How awesome can it be?

 Welcome to the new Home Page. It’s enhanced styling creates a fresh feel of wanting to create more maps to make analysis in a snap! But wait… there’s more! Other changes include:
  • Completely secure site. That means everything is in https
  • Simpler and better user interface
  • Improved account management
  • Faster map load
  • Improved layer page
  • Improved Support
  • Featured videos
Feel free to watch the videos or check some links. Or you can dive in to try the new mapping experience now!