Close
WE'RE ALL ABOUT
YOUR
SUCCESS
HOW WOULD YOU LIKE TO GET IN TOUCH:
Email
Email
Calendar
Cal
Close
WE'RE ALL ABOUT
YOUR
SUCCESS
HOW WOULD YOU LIKE TO GET IN TOUCH TO SCHEDULE YOUR DEMO:
Email
Email
Calendar
Cal
Mapline - mapping made powerful Close
Give us a call. We'd love to talk!

+1 800.969.1454

Close
Close
Geo Mapping Starter Close

Experience the power

Get ready to see your data in a whole new way!

Mapline Blog

Tune in for new updates, tips, tricks, and news about Mapline!

The Power of GIS Technology During Natural Disasters

We’ve all seen, heard about, and even felt the devastation caused by Hurricanes Irma, Jose, and Maria. Millions of people have lost their homes, don’t have access to electricity and water, and are in desperate need of relief efforts and emergency aid. For businesses, these natural disasters have impacted supply chain processes, transportation of goods, and the ability to restock products swiftly to keep up with demand. Despite these challenges though, GIS technology is making it easier for companies to prepare for impending storms. For example, Home Depot’s supply chain and merchandising teams worked around-the-clock to restock stores and transport goods in preparation of Hurricane Irma. GIS technology allowed brands like Home Depot to monitor stores, ramp up and activate the best distribution centers, and determine the best routes to get supplies in and out.

Mapline’s V5 Update

The biggest changes are here, and they’re taking the mapping experience to a whole new level! Since it’s Mapline’s goal to exceed the expectations of our users, here are the changes that we designed and developed over the past few months to bring you the best mapping experience in the most time-efficient ways.

New Store Opening: How Brands Use GIS Mapping for Strategic Growth

Retailers and restaurant chains play a constant game of Goldilocks and the Three Bears when hunting for the right site location to open a new store. One possible location may be in an area with a large enough population, but may be too close to a competitor. Another may be easily accessible, but not in an area with enough target consumers. So how do brands find just the right location to expand their business? This is where retailers and restaurant chains like Chick-Fil-A leverage GIS mapping software to help them make this decision.

Get Inside the Behaviors of Your Customers

No matter how perfect a retail site location is, it means nothing if a retailer’s consumers don’t live or shop in that location. When choosing a new location, retailers first have to get inside the mind of their customers and understand what their needs, wants, and purchase habits are. Ask yourself these questions:
  • Do your customers like to shop at other stores surrounding the site location you’re interested in?
  • Do customers in that location need your products or services?
  • Will customers travel to your location?
GIS mapping helps you answer these questions by providing insights into customer behaviors and purchasing preferences. Let’s take Chick-Fil-A as an example. The renowned restaurant chain operates 2,200 locations and opens up to 100 new sites a year. When deciding on a new location, Chick-Fil-A heavily relies on the data and spatial analyses it gets from GIS mapping software. The brand starts with census data and builds out buyer personas to better understand who the consumers are in the area that is being considered. This data and being able to visualize consumer purchase habits and behaviors helps Chick-Fil-A make strategic decisions when opening up a new restaurant.

Strategize Locations Down to the Very Intersection

Besides customer analysis, companies use GIS mapping to get visibility into other aspects of making a retail site selection, such as distribution and delivery routes, facilities management, competitor locations, and other traffic generators like shopping malls, stadiums, and airports. Spatial analysis then helps brands analyze the relationships between all of these factors. If a new store is opened here, are the routes around the location reliable for delivery and distribution? Are there enough shopping centers and events around to consistently draw crowds of people who would shop or eat at your store? For Chick-Fil-A, all these factors and more are considered when making a new site selection. Using spatial analysis, the restaurant chain can drill all the way down to the intersection to analyze potential new locations and determine if it’s a good spot to be in or not. At the same time, Chick-Fil-A uses the technology to view all its stores across the country, examine performance, identify trends, and determine why some stores are doing better than others. GIS mapping software has become the key way for businesses like Chick-Fil-A to efficiently visualize and analyze a lot of data at once and make quicker, more strategic business expansion decisions. How are you currently deciding where to open a new store location? Find out how GIS mapping can work for you.

How Real Estate Mapping Software Helped a RE/MAX Agent Increase Sales

Successfully selling real estate requires more than simply driving a client around to look at various properties. Real estate agents must have excessive knowledge of the market, research properties and gather information about each property that the client needs to know, and have strong negotiation ability to make a sale. To relieve concerns and questions their clients have about an expensive purchase like a new home, real estate agents need to market properties as well as they can. To do this, agents have started leveraging GIS for property mapping and data visualization to display property information. For one RE/MAX agent in Uruguay, real estate mapping software has helped him become more competitive in the market place and increase sales year over year. Juan Irala y Hernández opened his RE/MAX office in Uruguay in 2012 with the goal to become the top realtor in his region. Unlike realtors in the United States, though, Juan didn’t have access to the Multiple Listing Service (MLS), a suite of services that provides real estate agents with marketing information and competitor property listings. Without the MLS, Juan needed a different way to better market properties and close more real estate deals. The solution? Real estate mapping software that helped Juan analyze the real estate market and map out properties to show clients. After reviewing various property mapping solutions, Juan chose Mapline’s Excel mapping software. With Mapline’s capabilities, Juan started to do more market research and could upload his Excel database to create clean, visual property value maps. When Juan upgraded to an enterprise account in 2014, Juan received access to more advanced capabilities that have taken him far beyond the competition:

More Detailed Property Analyses and Client Discussions

With Mapline’s sublayers and shapes features, Juan could examine high demand and high value markets in the area and share them with clients. He was also able to provide more specific property data and information, making it easier to communicate with clients about property details and pricing.

More Fact-Driven Property Decisions

Real estate agents can’t expect clients to purchase a property based on their realtor’s personal opinions. Real estate agents need to be able to have fact-driven and objective conversations with clients about available properties. With Mapline’s features like sublayers, shapes, and heat maps, Juan could determine which properties were in higher or smaller demand, show clients local hot spots, and do deeper analyses that allowed him to have more fact-driven client conversations and led to more strategic selling decisions.

Greater Team Collaboration

A large part of Juan’s success has come from the increased collaboration he’s had with his team using real estate mapping software. Trying to analyze data in Excel and share different versions via email becomes confusing and inefficient. With Mapline, Juan has been able to share 24 maps and 25 datasets with nine of his colleagues. Together, they can share and view property value maps and information in real time, allowing for more strategic team discussions and better business decisions. Since leveraging the capabilities mapping software offers in the real estate industry, Juan has seen a 50 percent increase in business growth year over year. Mapping software like Mapline can give realtors a competitive advantage in the market place.

 Read the Entire Case Study

5 Ways Sales Mapping Software Streamlines Your Sales Process

Since the development and launch of the first GIS back in 1960, modern GIS mapping software has changed and grown to the point where it is leveraged by companies to analyze and improve sales performance. As a sales expert, your top priority is increasing revenue. You have plenty of data and information about your sales territories and customer accounts. But there’s a problem: Sifting through all that data in your Excel spreadsheets is tedious, time consuming, and frustrating. There’s also a major chance that going through your data manually won’t give you accurate results, which can lead to costly sales decisions. Sales mapping software not only helps prevent inaccuracies, but streamlines your entire sales process when trying to make decisions about your sales territories and routes. Below are five ways you can leverage sales territory mapping to drive efficiencies in your sales process and improve overall revenue performance.

Focus on Specific Sales Areas with Clear Visualizations

You probably have spreadsheet after spreadsheet of information like customer addresses, store locations, and other account data. Viewing hundreds of Excel rows and columns isn’t an ideal way to identify trends and analyze your sales territories. With GIS mapping software, you can use features like territory overlays to filter the types of information you want to visualize. For example, you may want to view sales territories by zip code or county. This allows you to more quickly and easily examine your territory performance.

Identify Opportunities and Underperforming Areas

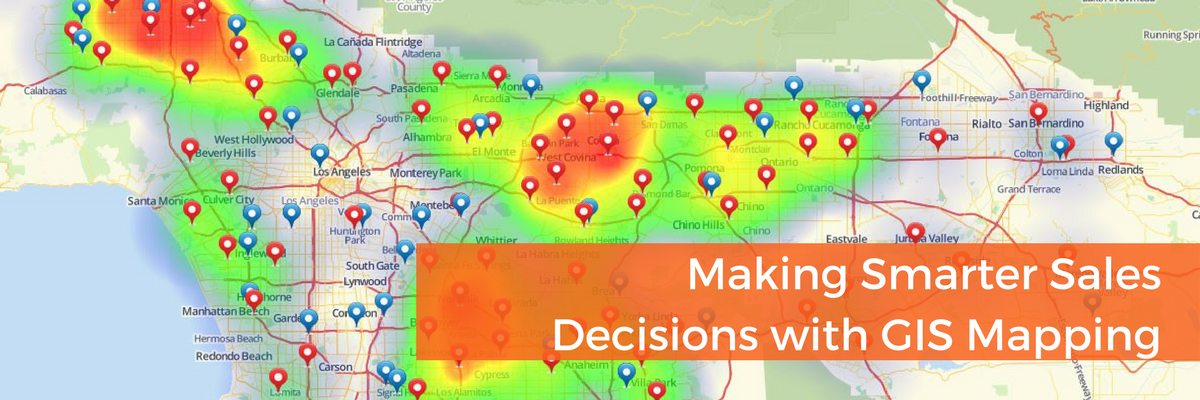
Trying to categorize which sales territories are performing well versus those that are not is difficult to do in an Excel spreadsheet, and can lead to unnecessary errors. When mapping your data, heat maps provide a color gradient to indicate higher-density areas. The brighter the color is on the map, the higher the density of your sales territory. Heat mapping lets you accurately determine what areas are the most successful, as well as which ones are underperforming and therefore require more resources.

Balance the Workload of Your Sales Reps

Do you know how the client or customer load is spread out across all your sales reps? What if you had a couple sales reps who were overworked and driving the most commission, while the rest lacked customers? With how much data and information is scattered throughout Excel spreadsheets, chances are you wouldn’t be able to catch those trends. When using sublayers, you can see the overall picture of where your clients are and how your sales reps are performing. If you are noticing that some sales reps have significantly more work than others, you can make decisions on how to balance the workload or figure out when the right time is to hire more to your team.

Strategically Optimize Routes

Time is money. And when your sales reps are in the field, the last thing you want them to do is travel routes that take longer and require more fuel. GIS mapping software helps you optimize your routes so you can reduce travel time for your sales reps and improve fuel efficiency. All this helps you increase the number of customers you reach, which improves your overall sales performance.

Greater Team Collaboration and Performance

Data spreadsheets don’t provide the insights and visibility you need to bring your sales team together to improve performance. And without visibility into your sales territories, you’ll miss opportunities and have a team of dissatisfied sales reps who won’t be able to see the growth and progress they’re making. When you map out your data, you can use features like pins and colors to call out leads and growth areas, so your sales reps have visibility into all the opportunities available, as well as what sales areas need improvement. Sales territory mapping and its capabilities can help streamline your sales processes by accurately showing territory performance, identifying which sales territories need more attention, and visualizing lead opportunities and showing the whole picture to unite your sales team. Learn how GIS mapping software can help you improve your sales performance.

 Learn More About Sales Territory Mapping