Author: Mapline
The Mapline Solution Suite
Territories Available in Mapline
How to Map Sales Territory Reports
Increase Visibility into Your Sales Performance
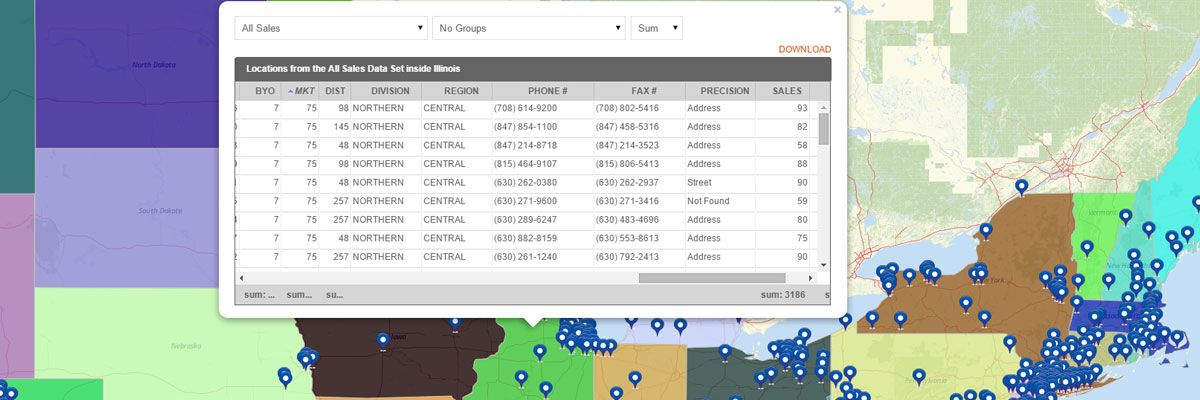
Sales territory reports provide full visibility into your sales performance you don’t get when looking at numbers in a spreadsheet. Sales summary maps created with our territory mapping software include:- Measurements – the shape of the territory, number of sides, area, and center coordinate
- Summary of All Data – summary of all data sets inside the territory which include name, location count, midpoint, and center of minimum distance. If you have sales numbers in your pins, then you can see the total or average sales for each territory.
- Export option – to download the territory report.
Steps for How to Create a Sales Summary Map
Creating a sales summary map is easy. Just build your map and place your sales data pins on the map. Then, overlay the territory you would like to view. To access the territory report:- Hover your mouse to a specific territory and click it.
- Your territory report will appear.
- Click the “Download” link.
That’s how easy it is to see territory performance reports! You can also create a heat map of your territories to visualize the performance.
Start Mapping TodaySegment Customers with Excel Data
Excel Mapping for Customer Segmentation Data
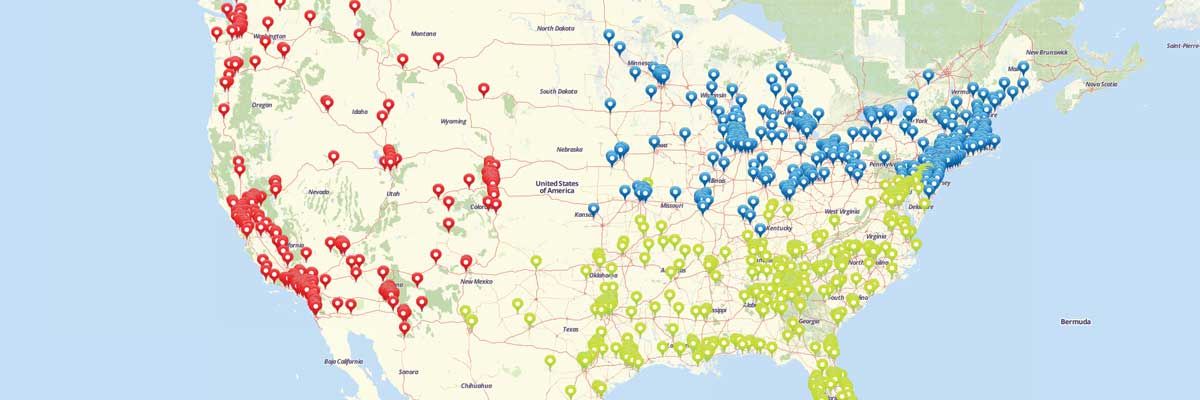
Customer segmentation has never been easier than with Excel mapping. By mapping with Excel data, you get a clear visual representation of information that was previously only available in spreadsheet format. With Mapline, you can segment customers based on any data you have in an Excel spreadsheet. Let us give you an example. Let’s say you want to be able to segment and differentiate your customers based on which policy they buy. First, you need to map Excel data.Once you have all your locations mapped, you can use the Segment tool to group your pins by any column from your spreadsheet. So, just click on the layers options and select the segment option. Then you can choose the Policy column from your spreadsheet. Done! You can see trends in where certain policies are being sold to help you segment your customers and enhance your marketing efforts.
That’s how simple it is to segment customers by mapping Excel spreadsheet data. Market segmentation data can be invaluable for understanding what’s happening with your business and getting a leg up on the competition. Decide on the right plan and pricing for you and try it out for yourself.
How to Create a Map with Segments
Group Pins on Your Maps for Better Insights
Specifying locations with pins helps you identify trends and outliers, but what if you’re looking at too many locations at once? All that data viewed at once can get confusing and start blending together. With the segment feature, you can categorize your pin segments and narrow in on what you actually want to look at. Follow our step-by-step instructions to add segments to your maps where you can visualize customer segments, location types, regions, and more.Steps to add Segments to your map
- Create a new map and add a dataset on your map.
- Click layer options menu next to the layer on your map.
- Select the “Segment” option.
- Click the “Add tier of segments” button.
- Select the category from your Excel spreadsheet that you would like to use as categories on your map.
- Click Done.
That’s all it takes to group your pins and assign different icons for different groups of locations!


