Mapline Blog

Tune in for new updates, tips, tricks, and news about Mapline!

New Feature: Change Map Territory Outline Colors

For enhanced mapping experience, we’ve added a new feature! Users can now change the map territory outline colors. When a territory is added to a map, users will see a red-colored icon (default color) at the right side of the territory name. Simply click it to change the color to whatever you’d prefer!


New Feature: Use Custom Images For Map Location Markers

In our continuous commitment to make mapping simple, we’ve just added another helpful feature – Custom Marker Images! This feature is helpful for businesses to easily identify the locations mapped from their spreadsheets. Not only will the presentation be even more visual, but having great location markers helps tell the story behind the data. Here’s an example. If you are a small business owner and you want to know your market and competitors, instead of simply using colored tear-shaped icons, you can use a custom logo or business image to represent each set of competitors. These customized icons will help you better understand your location as well as your market.

New Feature: Customize Your Map Markers!

Tired of seeing the usual tear-shaped orange markers on your map? Then listen to our announcement of new features! You can now customize your marker shapes, colors, stamps, and sizes! Take a look at some of the options you can now build. New Feature: Customize Map Markers

A wide variety of shapes, colors, sizes and stamps are available:

  • Circle
  • Hexagon
  • Pentagon
  • Square
  • Star
  • Tear
  • Triangle

We still have 12 colors you can use:

  • Black
  • Dark Blue
  • Dark Green
  • Grey
  • Light Blue
  • Light Green
  • Orange
  • Pink
  • Purple
  • Red
  • Turquoise
  • Yellow
Also choose from 10 different sizes!

New Feature: Heat Mapping Excel Spreadsheet Data

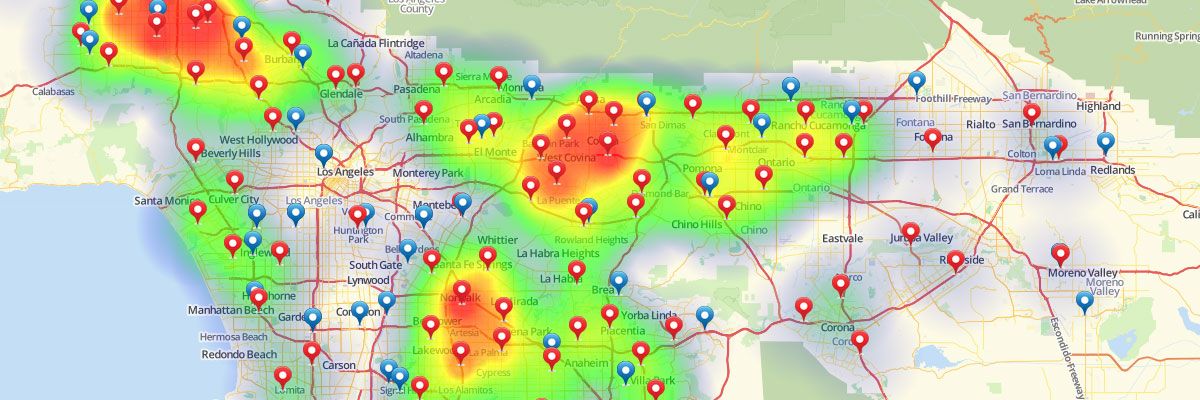
Have you ever wanted to group your customers together and visualize the highest performing Zip Codes, Counties, or State Territories? Well, now Mapline empowers you to build heat maps of your data with a simple copy and paste from Excel! Use our heat mapping tool to inform you in identifying growth opportunities or help you know where to focus your marketing investments. Determine the best areas to allocate capital investments or determine high-performing territories. New Feature: Heat Mapping

Heat Mapping In Your Business

It’s easy to build heat maps using any columns from your spreadsheet. For example, if you have a list of customers and their annual sales in your spreadsheet, then you can make a heat map three different ways:
  • Customer Density where each Zip Code (for example) will be colored according to the number of customers within that boundary
  • Customer Total Sales where each Zip Code would be colored according to the total sales from all customers in the territory
  • Customer Average Sales where each Zip Code would be colored by the average (per customer) sales

Mapping Updates!

We’ve been hard at work on some awesome mapping updates! Check out our most recent enhancements:

Search Locations on Map:

Use the Search Box to quickly zoom to locations on your current map.

Easier to Manage Shared Maps:

See who your map is shared with and easily grant permissions.

Quickly Show or Hide Data Layers:

Easily check the box to show or hide certain locations.

And More!

We’ve also officially launched our Mapline Plus Membership–which gives you even more feature to improve your mapping! Take a look at all you get as a member! Additionally, you can try it out for free by sharing us on your favorite social network. No payment info is require–once you share, your account gets membership for a month. It’s that easy!

Now We’ll Remember Your Map Zoom Level

I wanted to give an update on some of the enhancements we’ve made with the mapping views. When you leave your map, your zoom levels will be saved so that you can start back up right where you left off! If you close your browser, no need to worry because when you come back to your map, you will have your last view showing by default. We have about a billion enhancements to make, and we just can’t code fast enough! Thanks for all your feedback, and PLEASE keep the suggestions coming! Also, it is super helpful to see how you are actually using the application. Drop us a note and let us know how you have found it useful or what you would need for it to be more useful.